
Record-low snow, record warmth: what a century of data says about Steamboat’s winters
Excerpt; also works as the deck): All 11 long-running snow sites near Steamboat hit record lows on April 1 after Routt County’s warmest November-through-March in 131 years of records. The long record shows winters warming, with no long-term decline in precipitation.
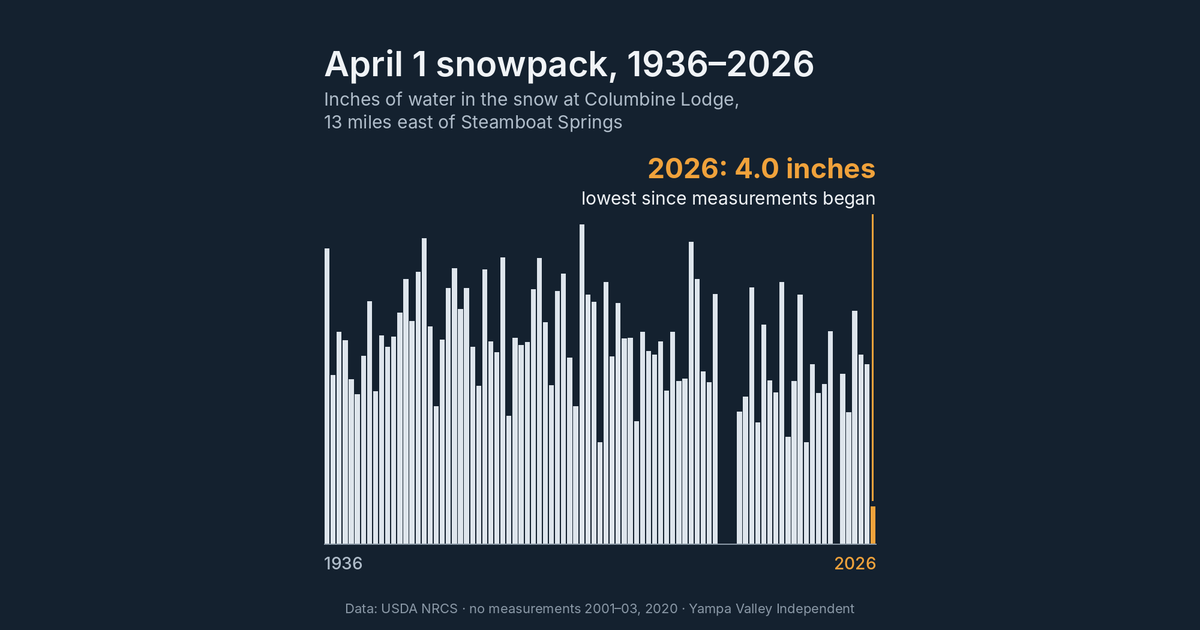
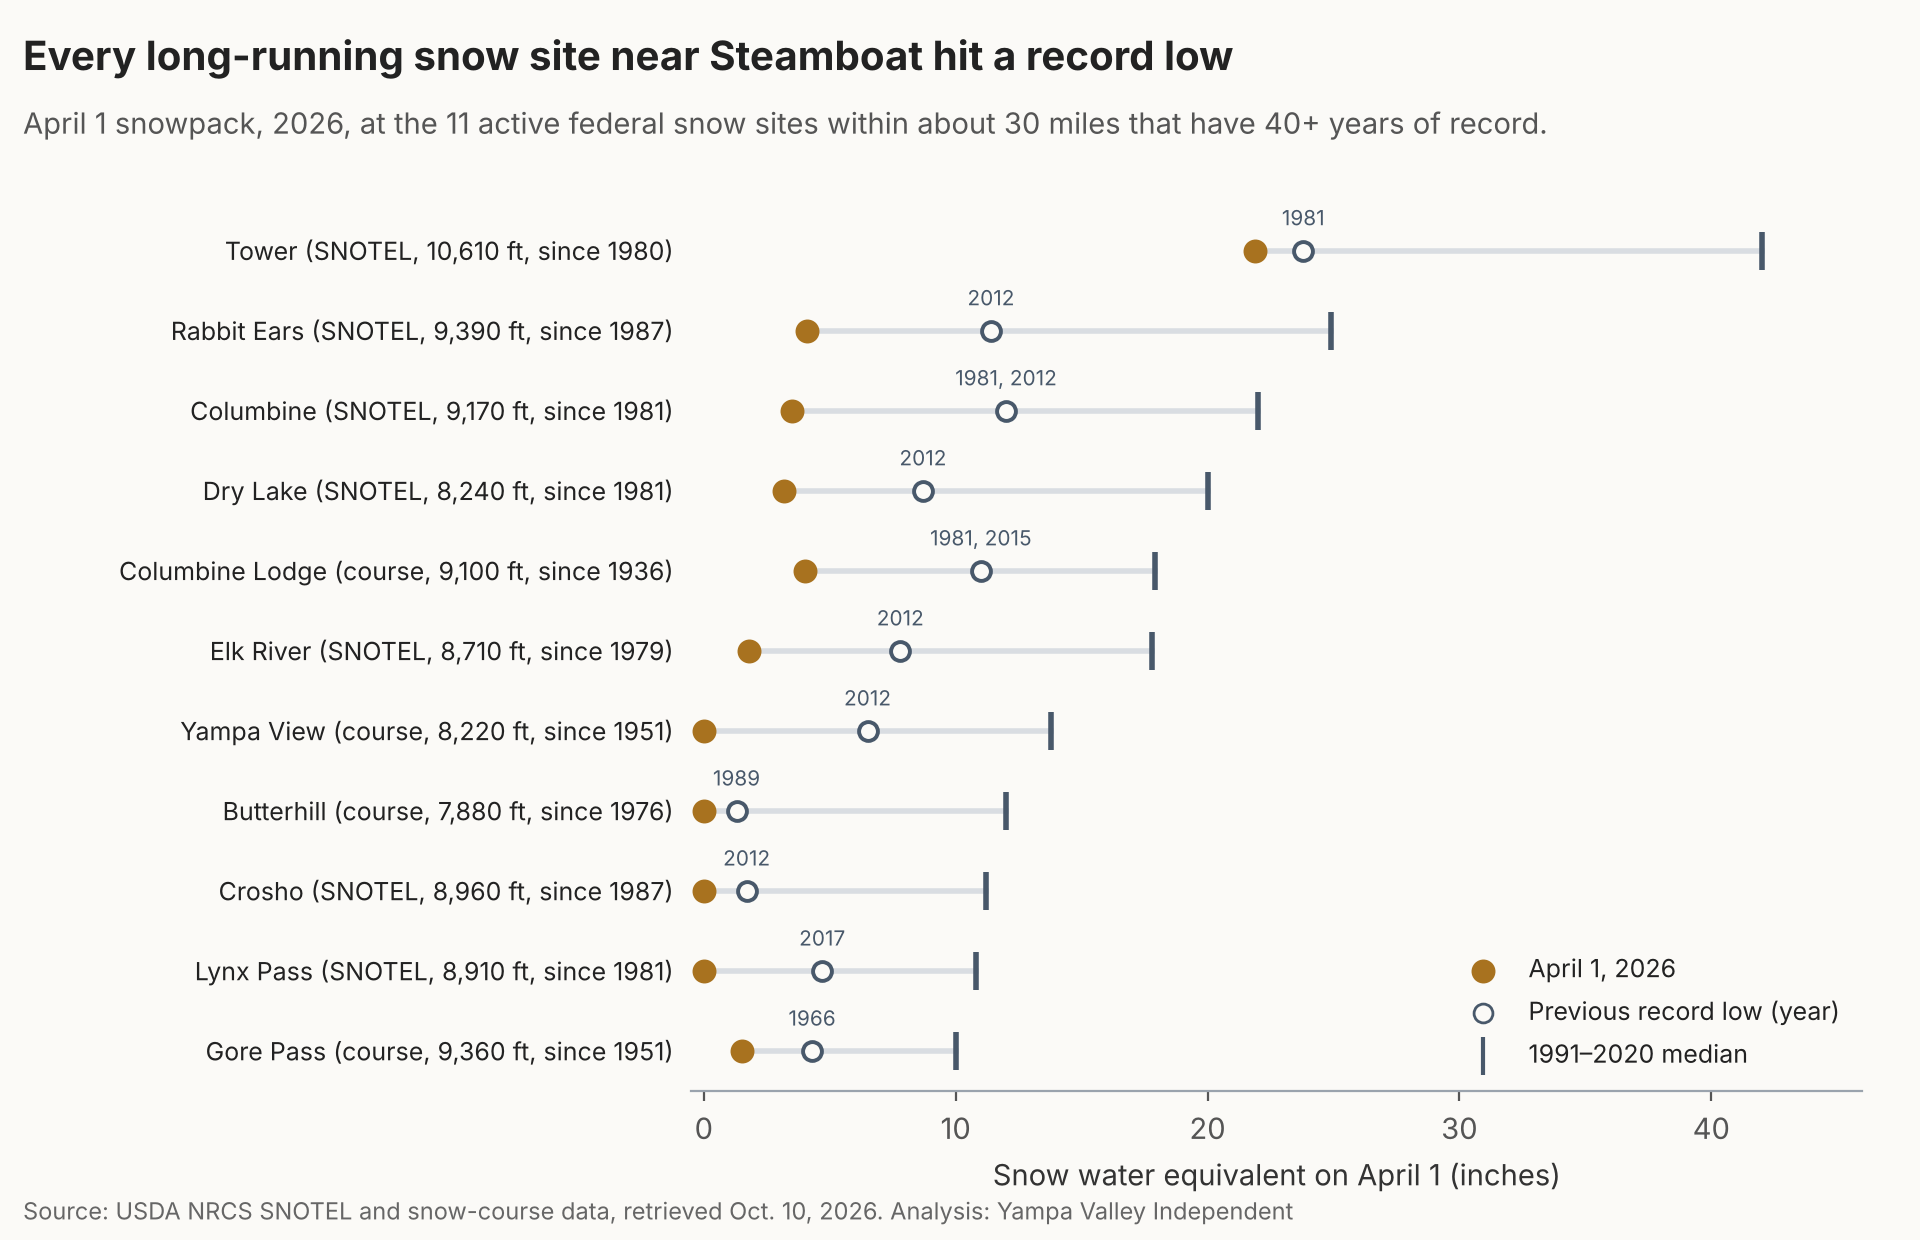
STEAMBOAT SPRINGS — On April 1, the date Western water managers use to take the measure of a winter, all 11 long-running snow-measuring sites within about 30 miles of Steamboat Springs recorded the lowest snowpack in their histories. Four were bare.
At Dry Lake, about 4 miles northeast of downtown at 8,240 feet, a federal sensor measured 3.2 inches of water in the snowpack. That was 16% of the 1991–2020 median and well below the previous low of 8.7 inches, set in 2012. At the Columbine Lodge snow course, 13 miles east of town, where surveyors have measured the snow most springs since 1936, it was 4 inches. The previous low, 11 inches, came in 1981 and again in 2015.
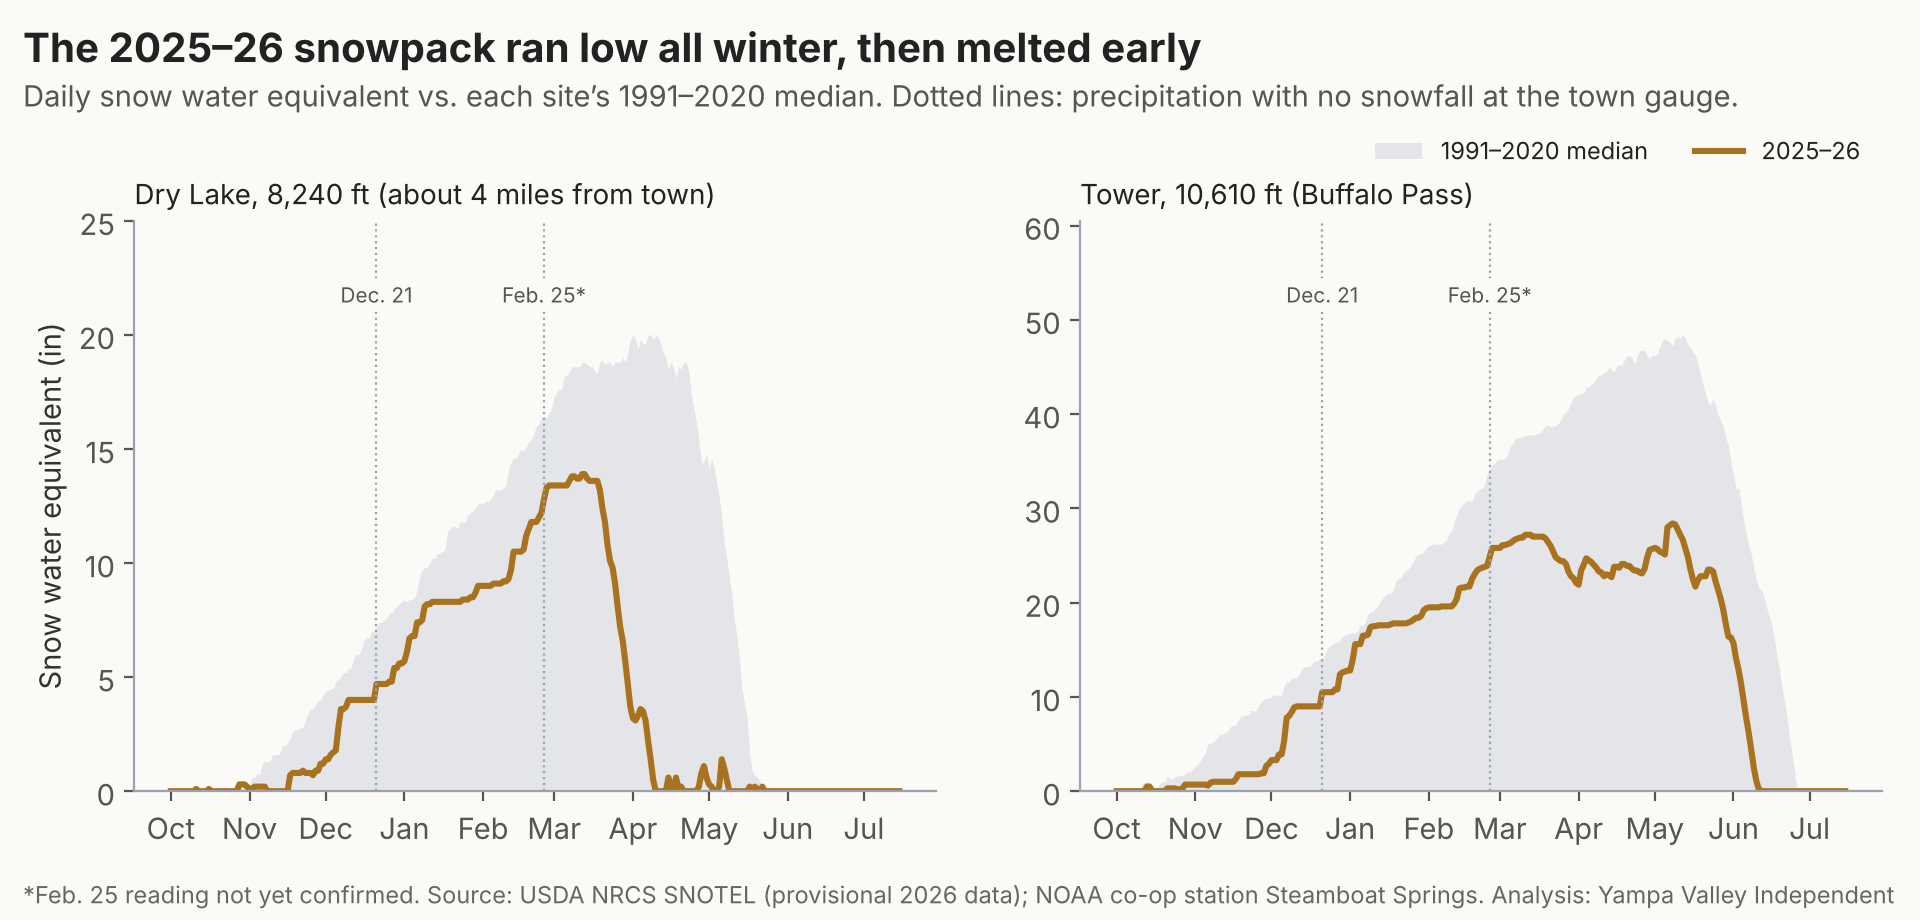
The November-through-March stretch was Routt County’s warmest in 131 years of records, federal climate data show. Twice in the heart of ski season, the National Weather Service cooperative station in town recorded 0.2 inch or more of precipitation with no snowfall, a sign of rain: 0.22 inch on Dec. 21 and 0.91 inch on Feb. 25. The February reading is provisional and still needs confirmation from the National Weather Service. Then came the county’s warmest March on record, which melted much of what had fallen.
One bad winter is weather. Whether it fits a longer pattern is a question for the long-term record, so the Yampa Valley Independent analyzed more than a century of federal temperature, precipitation, snowpack and river data for the area. In short:
- Winters are warmer. Routt County’s average November-through-March temperature over the past 10 winters, including last, was about 3.6 degrees higher than in 1901–1930.
- Precipitation shows no long-term decline. Winter precipitation shows no long-term trend in county records or at mountain gauges, and the past 10 winters, including last, averaged about the 1991–2020 normal.
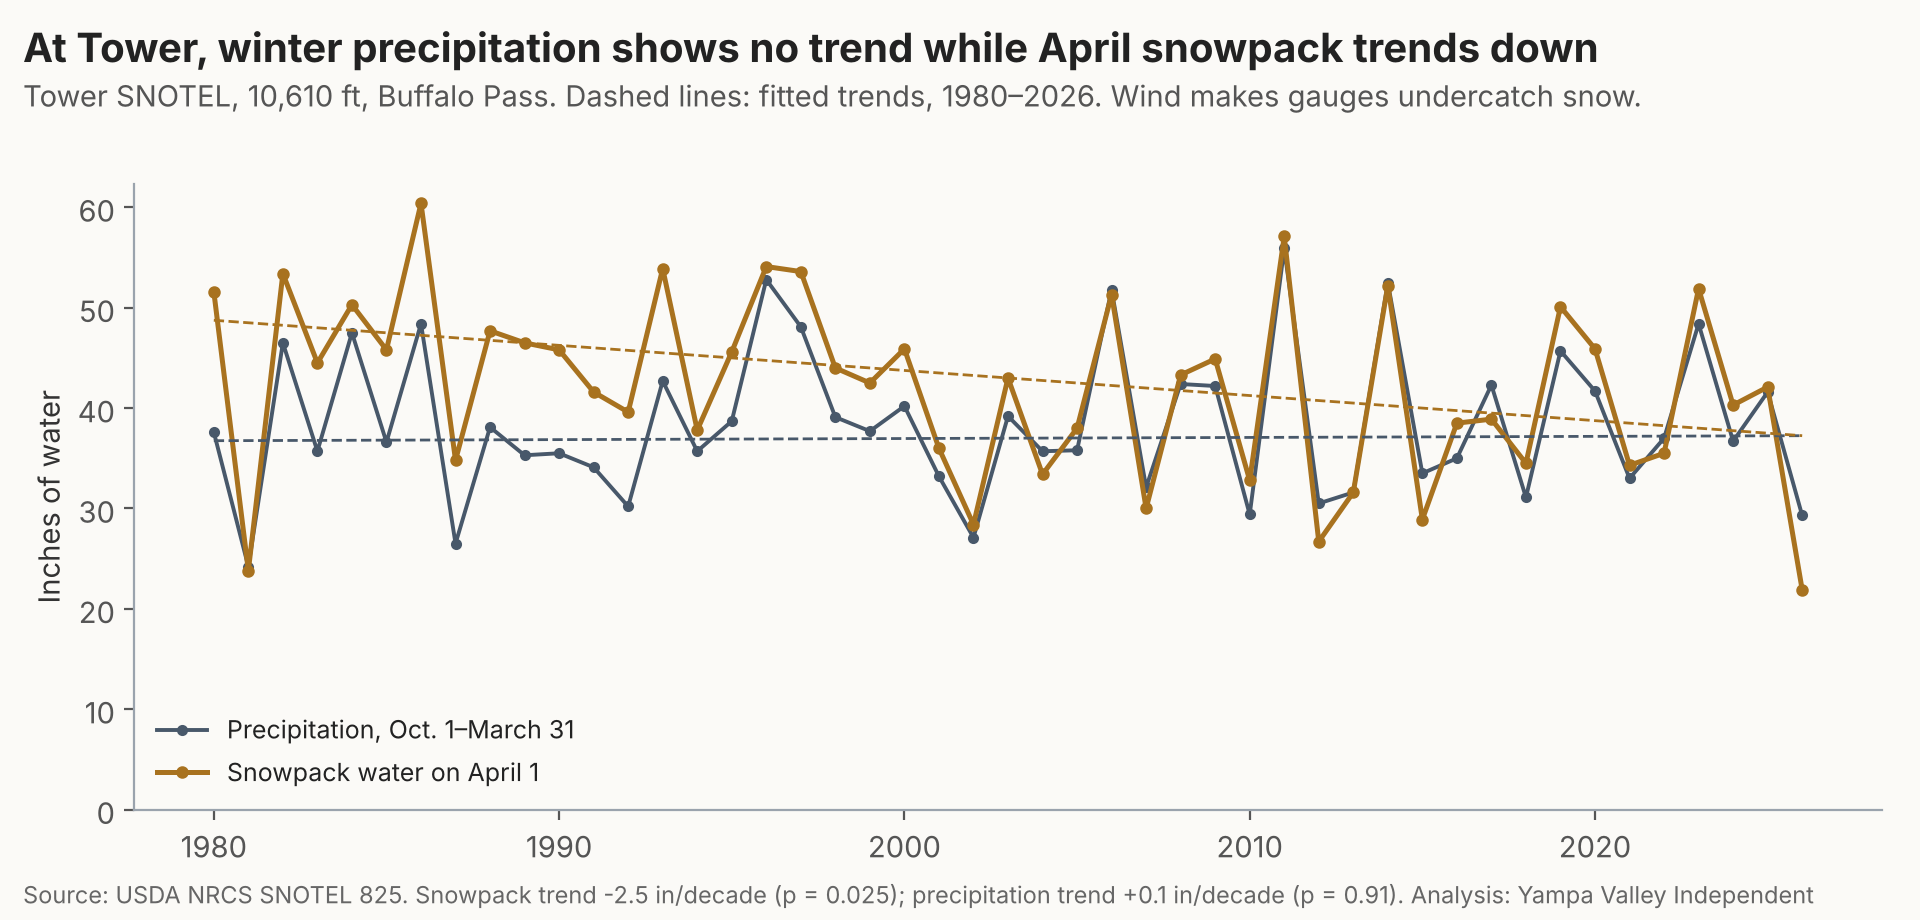
- At Tower, snowpack is down while precipitation isn’t. At 10,610 feet on Buffalo Pass, Tower’s April 1 snowpack has trended down about 2.5 inches of water per decade since 1980, a trend that is statistically significant only with last winter included, while precipitation over the same months shows no trend.
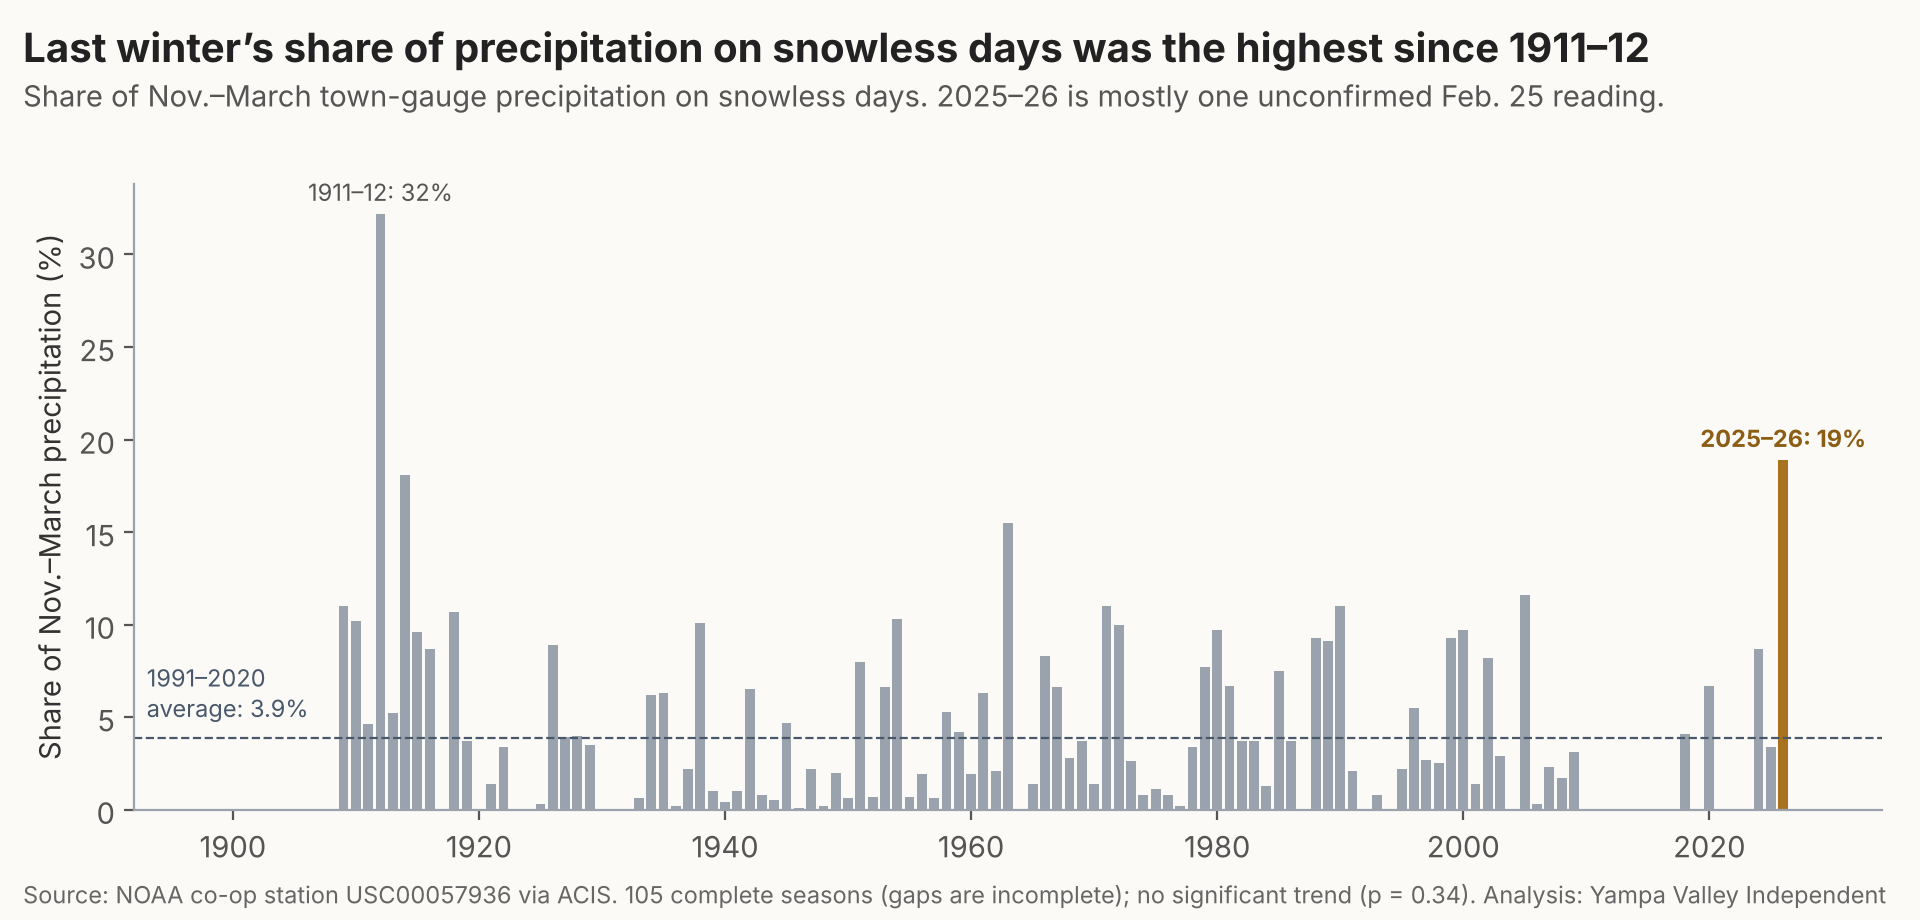
- In town, no trend toward more rain. Last winter, 19% of the precipitation at the town gauge fell on days with no snow, the highest share among winters with complete records since 1911–12, and most of it came in one storm. Over 105 complete winters, though, that share shows no statistically significant increase.
How the season unfolded
The snowpack started late and stayed low. On Jan. 1, Dry Lake held 5.7 inches of snow water, about two-thirds of its median of 8.4 inches for the date. December was Colorado’s warmest in more than 130 years of records, according to the Colorado Climate Center at Colorado State University. At the Steamboat station it averaged 29.9°F, the warmest of 112 Decembers with at least 28 days of records there. On Christmas Eve, the temperature at Dry Lake never fell below 36°F.
The two storms that likely brought rain to town fell as snow higher up. At Tower, temperatures stayed below freezing; the station gained 1.5 inches of snow water Dec. 20–21 and 1.9 inches Feb. 24–26, and its snow depth rose 8 and 5 inches. At Dry Lake, lower and closer to town, temperatures hovered near or just above freezing during the February storm. The line between rain and snow ran somewhere between the town gauge, at 6,866 feet, and Tower.
March did the most damage. Steamboat hit 81°F on March 22 and again on March 26, according to provisional station data, 11 degrees above the station’s previous March high of 70°F, recorded in 1897, 2004, 2012 and 2017. Routt County’s March average temperature, 39.1°F, was the highest in 132 years. Dry Lake’s snowpack peaked at 13.9 inches on March 12 and was gone by April 10, six weeks ahead of its median melt-out date of May 22. Rabbit Ears peaked March 9 and melted out April 24; its median melt-out is June 5. Statewide, snowpack peaked March 9, about four weeks earlier than usual, according to the federal National Integrated Drought Information System.
By April 1, Colorado’s snowpack averaged 3.3 inches of water across 115 SNOTEL stations, 22% of the 30-year median and the lowest in the network’s statewide record, which begins in 1987. State Climatologist Russ Schumacher, director of the Colorado Climate Center, called it “the worst year for Colorado snowpack in recorded history.” At 60 of the 64 Colorado snow courses with at least 50 years of data, this year’s reading set or tied a record low.
The long record
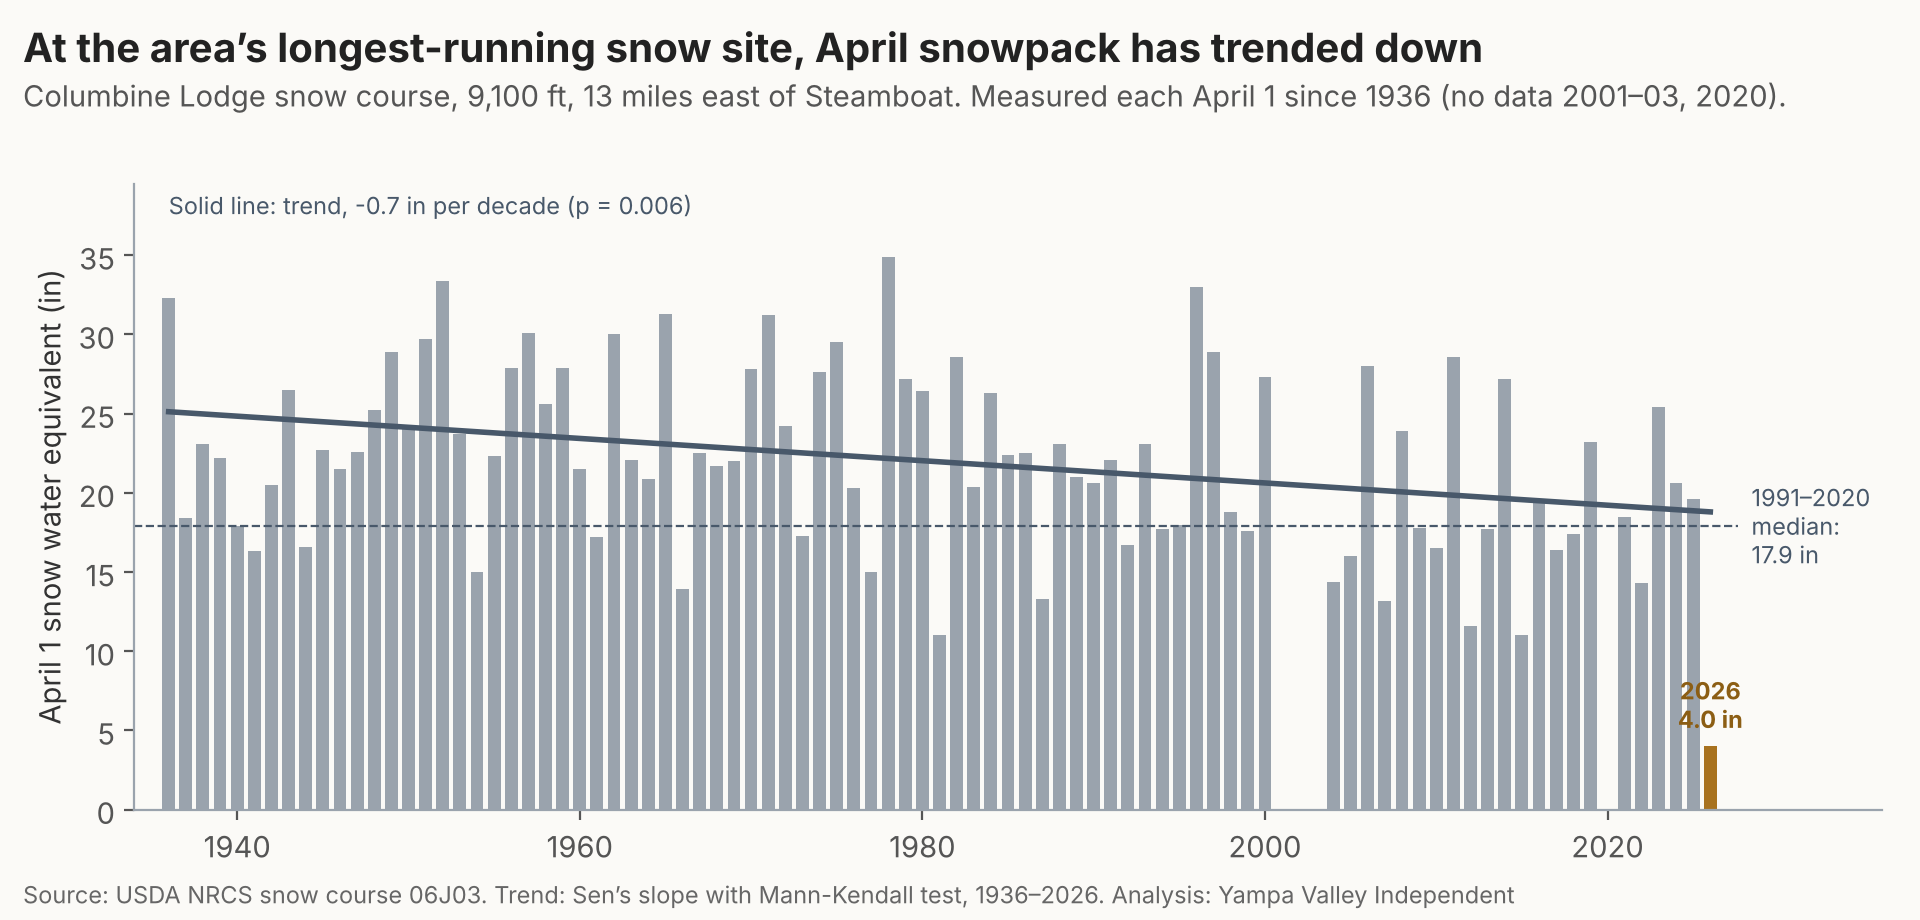
Snowpack swings widely from year to year, so short records can mislead. The Columbine Lodge snow course, in Jackson County 13 miles east of Steamboat at 9,100 feet, has the longest record nearby: April 1 measurements in 87 of the past 91 years. Its April snowpack has declined about 0.7 inch of water per decade, a statistically significant trend. It averaged 23.9 inches in 1936–1965 and 20.3 inches in 1996–2025.
Tower, at 10,610 feet, shows a steeper decline: about 2.5 inches per decade since 1980. That trend is significant with last winter included; without it, the trend narrowly misses the usual statistical threshold.
Elsewhere the picture is mixed. Ten of the 11 long-running sites show downward slopes since their records began, and Gore Pass shows none. Only three of the declines (Columbine Lodge, Tower and Butterhill) are statistically significant, and only Columbine Lodge’s remains so when last winter is left out; the others could be chance. A 2018 study of Western snow records led by Philip Mote of Oregon State University found that more than 90% of long-record snow sites across the West showed declines and, using model experiments, that across much of the Rockies precipitation trends have determined snowpack trends. Colorado State University’s 2024 Climate Change in Colorado report says such studies found warming was an important cause of Colorado’s snowpack declines, with below-normal fall and spring precipitation also playing a role. Statewide, the report found that April 1 snowpack this century has run 3% to 23% below the 1951–2000 average in the state’s major river basins, and that most model projections show declines of 5% to 30% by 2050 compared with 1971–2000.
Warmer winters
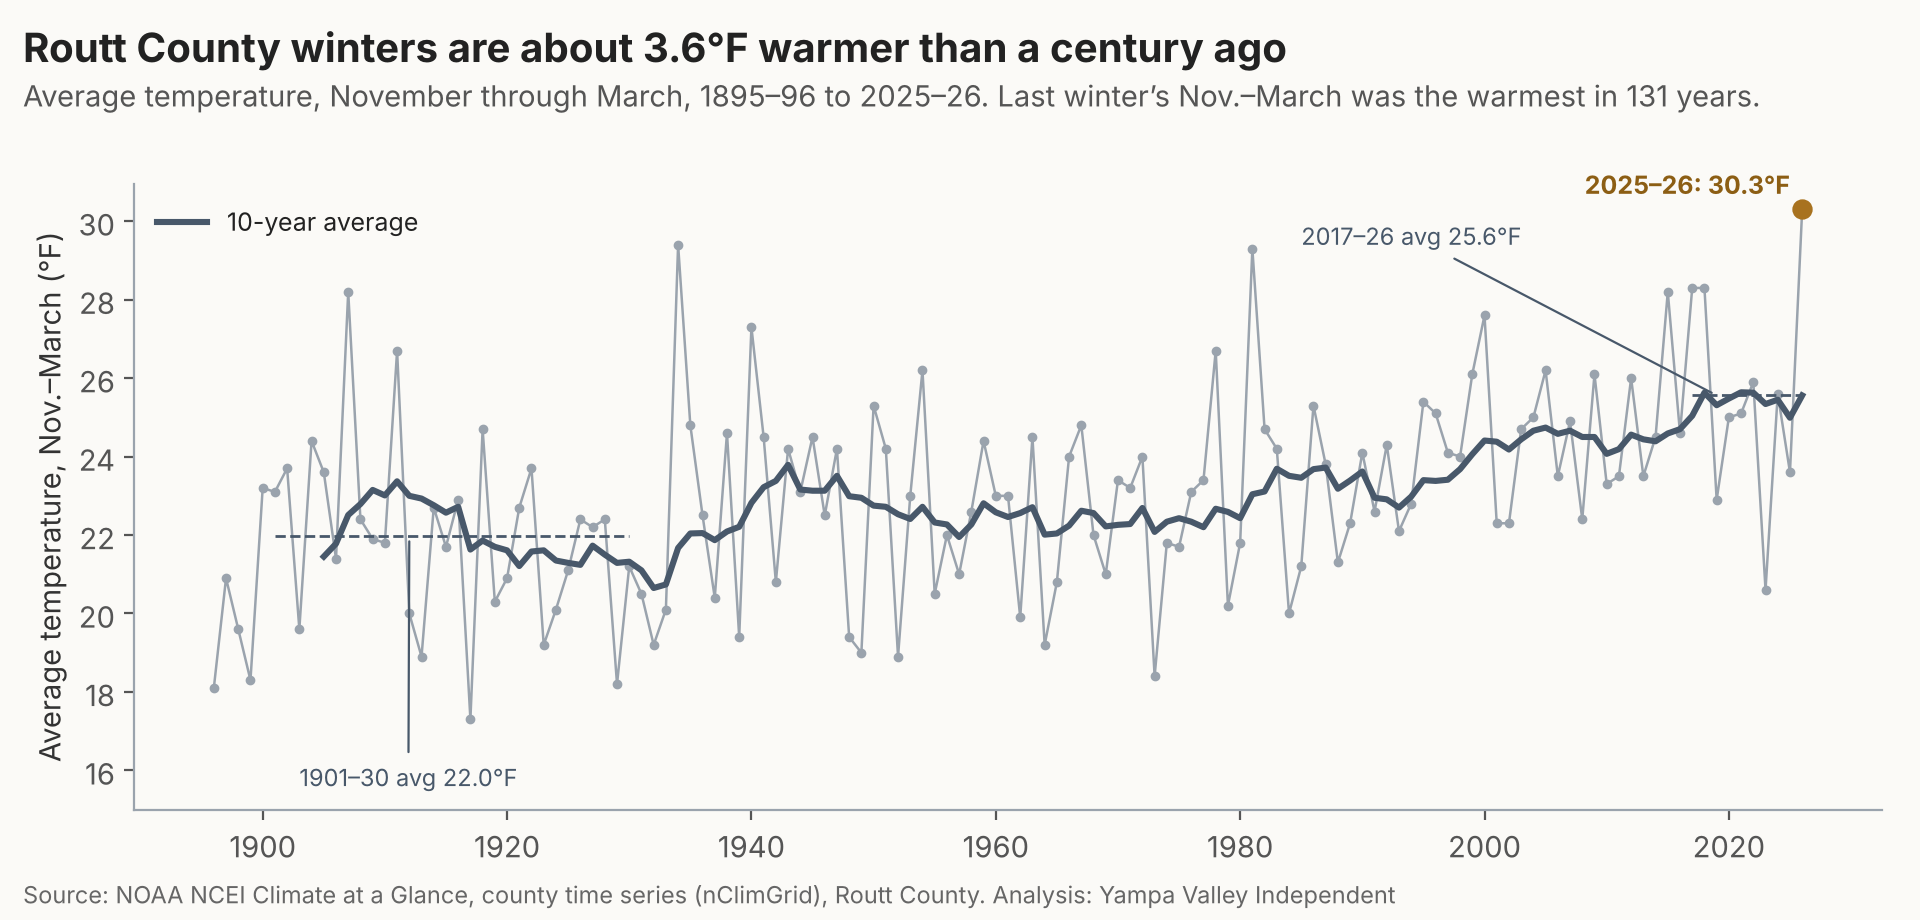
NOAA’s county temperature series for Routt County, built from adjusted weather-station records back to 1895, shows November-through-March temperatures rising about 0.3°F per decade, a statistically significant trend. Since 1970 the pace has been faster, about 0.55°F per decade. The past 10 winters, including last, averaged 25.6°F, about 3.6 degrees above the 1901–1930 average of 22.0°F. Last winter’s 30.3°F broke the record of 29.4°F set in 1933–34.
Over the full record, nights have warmed faster than days. Average winter low temperatures have risen about 0.4°F per decade, and last winter’s average low, 20.6°F, was also a record. Statewide, Colorado’s annual average temperature rose 2.3°F from 1980 to 2022, according to the CSU climate report.
More precipitation, less snow?
Some climate projections point to wetter winters in Colorado. Most climate models project more winter precipitation statewide by 2050, according to the CSU report. For annual precipitation, the range of projections for the state’s northern climate divisions, including the Northwest, is shifted toward wetter outcomes than in the south, though in every division the models disagree on whether precipitation will rise or fall. The same report says only large increases in precipitation would offset warming’s effect on streamflow, an outcome it calls unlikely.
So far, winter precipitation in Routt County shows no long-term trend. The past 10 winters, including last, averaged 12.4 inches of precipitation from November through March, about the 1991–2020 normal of 12.3 inches. Last winter brought 8.2 inches, the sixth-lowest total in 131 years.
What warming changes is the form precipitation takes and how long it lasts on the ground. A West-wide study led by Noah Knowles of the U.S. Geological Survey found that from 1949 to 2004, a shrinking share of winter precipitation fell as snow, with the biggest declines in March. In early February, Colorado Public Radio, citing NOAA data, reported that the West’s snow drought was being driven by record warmth that made precipitation fall as rain instead of snow and by a lack of major storms in January. A 2018 modeling study led by Keith Musselman projected that under a high-emissions scenario, rain falling on snowpack, which speeds melt and can cause flooding, would become more frequent at higher elevations and less frequent at lower ones, with some of the largest increases in flood risk in places including the Colorado River headwaters.
At Tower, the precipitation gauge’s October-through-March totals have shown no long-term trend since 1980, while the snowpack on April 1 has trended down. In the 1980s, Tower’s April snowpack held about 20% more water on average than its gauge had measured; since 2010 the two have been roughly equal. Gauges can undercount wind-blown snow, and changes in equipment could also affect the comparison. Across five mountain sites with records back to 1981, the April 1 snowpack held water equal to 99% of the season’s measured precipitation in the 1980s, 88% in the 2010s and 95% in 2020–2025, before falling to 25% last winter. The overall decline is statistically significant only when last winter is included, and a seven-site comparison since 1987 shows no significant trend.
In town, a shift to rain is harder to see. The Independent added up precipitation that fell on days when the National Weather Service station recorded no snow at all. Last winter, 19% of November-through-March precipitation fell that way, including the Dec. 21 and Feb. 25 storms. In the 20 winters from 1991 to 2020 with complete records, the share averaged 4%, and among all complete winters only 1911–12, at 32%, had a higher share. Most of last winter’s snowless-day precipitation came from the 0.91-inch Feb. 25 reading, which still needs confirmation from the National Weather Service; without it, the share would have been about 8%. Across 105 complete winters since 1894, though, the share shows no statistically significant trend.
The difference matters for water supply as well as skiing. Snow that builds up over the winter is more likely to reach streams as runoff than the same amount of rain, the CSU report notes.
The river
The early melt showed up in the Yampa River. At the U.S. Geological Survey gauge in Steamboat, half of the water year’s flow had passed by May 7, tied for the third-earliest date in 118 years with complete or nearly complete records; the 1991–2020 median was around May 24. The river peaked at 1,020 cubic feet per second on May 15, the second-lowest annual peak in daily average flow on record, after 1977, and about a third of the 1991–2020 median peak of 2,950 cfs. Since 1905, the annual peak has arrived earlier by about 0.6 day per decade, a small shift that is only borderline statistically significant. Upstream reservoirs and diversions also shape the river’s flow, so the gauge reflects more than climate.
In July, city officials closed the Yampa through town to commercial and recreational use for weeks because of low flows and high water temperatures, KUNC reported. Earlier, Mount Werner Water and the city had declared Stage 2 drought conditions after an unusually warm winter and record-low snowpack, according to the Western Resilience Center; on July 22, the city, Mount Werner Water and the Steamboat II Metropolitan District began a mandatory schedule allowing watering on two days a week.
What it cost
The ski industry’s largest public company has put numbers on the season. Vail Resorts, which operates five Colorado ski areas but not Steamboat, reported net income of $147.5 million for the fiscal year that ended July 31, down from $280.0 million a year earlier. Company-wide, its resort earnings before interest, taxes, depreciation and amortization fell 11.7%, to $745.7 million, a decline it said was primarily driven by weather, and skier visits fell 13.4%. Chief Executive Rob Katz called it “the most difficult weather environment we have ever experienced.” In April, the company said visitation at its resorts in Colorado and Utah had declined 25%. Unit sales of season passes for the coming winter were down about 12% through Sept. 18, and pass sales dollars about 6%. The company forecasts a rebound this fiscal year, with resort EBITDA of $805 million to $865 million, which it said would be supported by more lift-ticket visits, higher prices and more guest spending after the weather-hit season.
Steamboat Resort is owned by Alterra Mountain Co., a private company that does not publish resort results. The resort closed for the season April 5, a week before the April 12 date it had set two weeks earlier, calling it one of Colorado’s worst snow seasons on record. It had about 12% of its terrain open as of March 30, the ski news site SnowBrains reported. SnowBrains put the season’s snowfall at 155 inches as of March 30, and KUNC later reported about 170 inches; the resort lists its 10-year average as 289 inches.
In town, city sales tax collections fell in every month from December through April compared with a year earlier, according to city figures published in the Steamboat Springs Chamber’s monthly tourism dashboards. The Chamber described March as a tough month for visits, “mainly due to historically low snowfall”; for December, it said occupancy rose 3% but guest nights and spending fell. By the dashboards’ own percentages, monthly collections fell 2.4% to 12.4% this winter, after ranging from 3.3% below to 1.4% above the prior year a winter earlier.
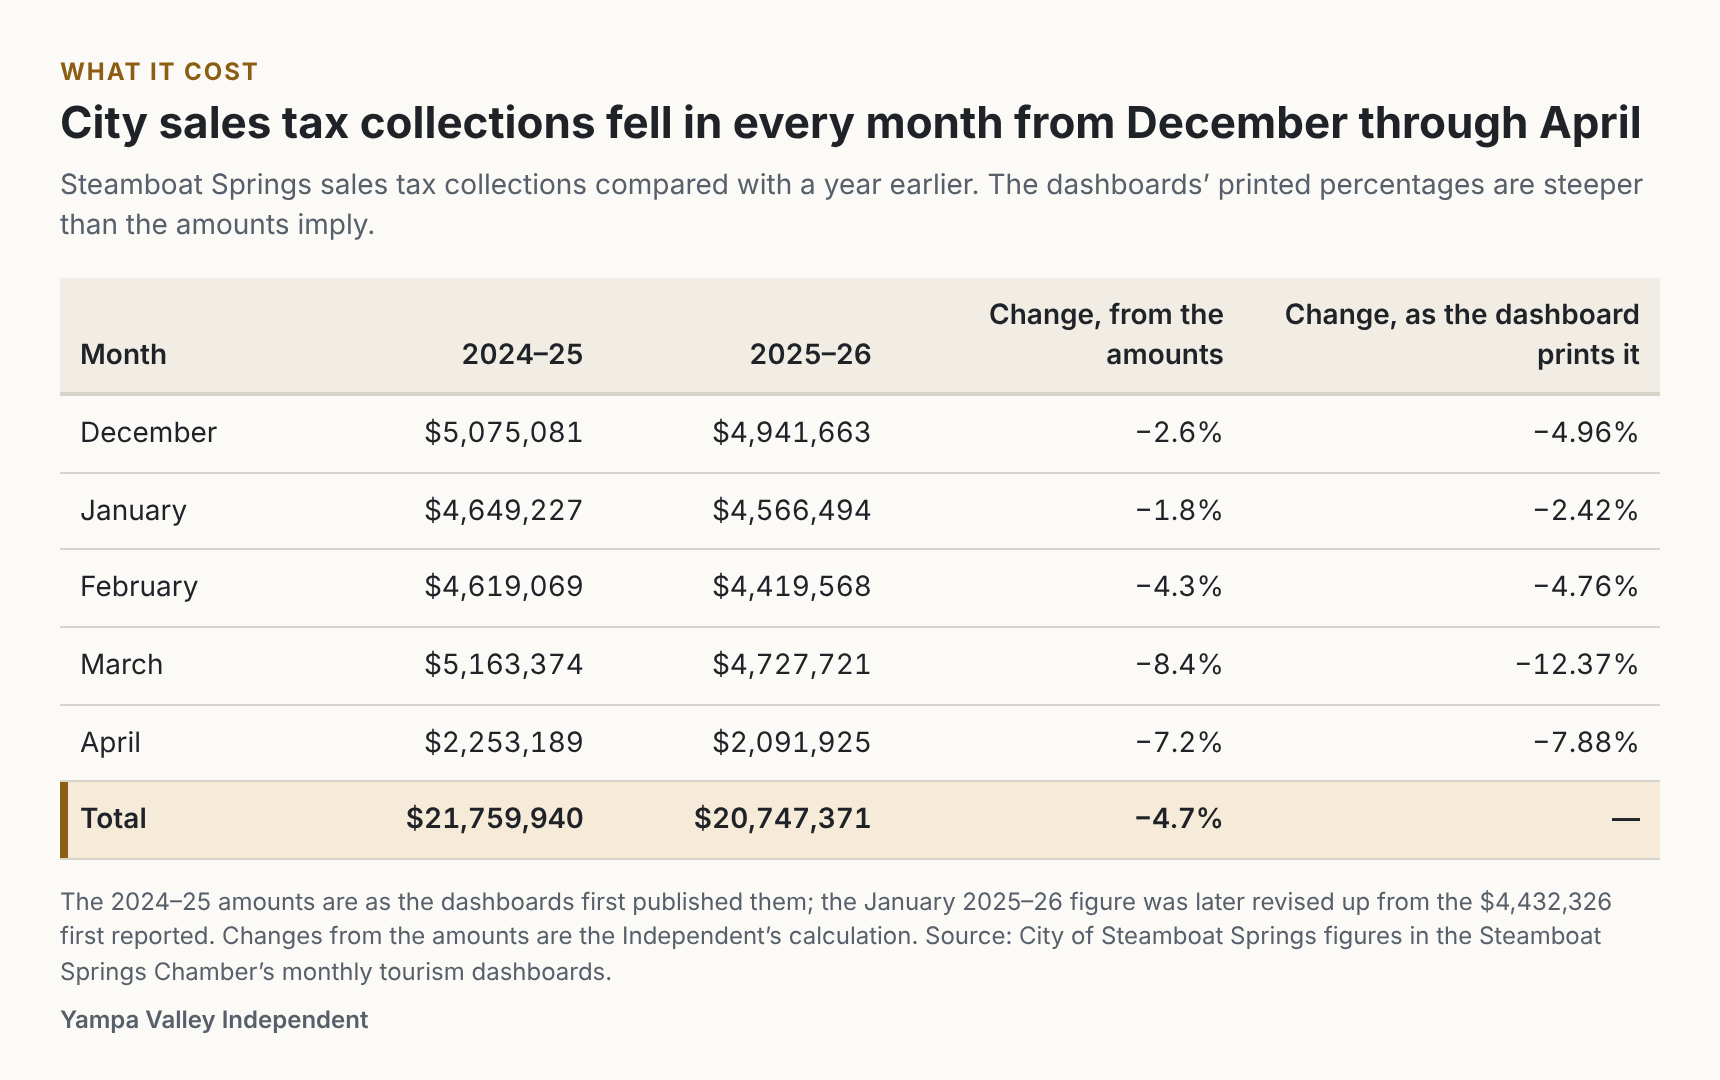
The 2024–25 amounts are as the dashboards first published them; this winter’s January figure was later revised up from the $4,432,326 first reported. The dashboards’ own percentages are steeper than the amounts imply; the Independent is asking the city why. Accommodations tax and short-term rental tax fell 18% and 20% in March, by the dashboard’s figures, and total lodging occupancy fell 15%. The Chamber estimates that visitors pay about 40% of the city’s general sales tax. Sales tax was projected to supply roughly 60% of the city’s general fund revenue this year, Finance Director Kim Weber told council in March, according to a Steamboat Pilot & Today report republished by KUNC.
What’s next
- Oct. 20: City Council holds the first reading of the 2027 budget.
- Nov. 21: Steamboat Resort’s scheduled opening day for 2026–27.
How we did this
The Independent downloaded daily and monthly records from federal sources on Oct. 10, 2026: snowpack from the Natural Resources Conservation Service’s SNOTEL stations and manual snow courses; weather from the National Weather Service cooperative station in Steamboat Springs; county temperature and precipitation from NOAA’s Climate at a Glance; and Yampa River flows from the U.S. Geological Survey. We included every active snow site within about 30 miles (50 kilometers) that has at least 40 years of April 1 measurements, and we report all 11. Trends use Sen’s slope with a Mann-Kendall test, a standard method for climate records; we call a trend statistically significant when the test’s p-value is under 0.05, meaning a trend that strong would turn up by chance less than 5% of the time if there were no real trend. We did not adjust for testing many sites at once or for year-to-year persistence. To measure rain in town, we added up precipitation on days the station recorded no snowfall, and we left out winters with less than 90% complete records. Figures for 2026 are provisional. The data, code and a full method note are available on request.