
Through October, 2026 is Routt County's warmest year in 132 years of records
Every month has warmed since the 1950s, March the most. This fall had the fewest snowmaking hours at mid-mountain since at least 1950, and seven climate models show 3 to 5 more degrees by the 2040s.


Climate and Steamboat's economy, Part 1
Key points
- Through October, 2026 is the warmest year in NOAA's 132-year record for Routt County. March and July were the warmest on record for those months. NOAA's figures for recent months are preliminary.
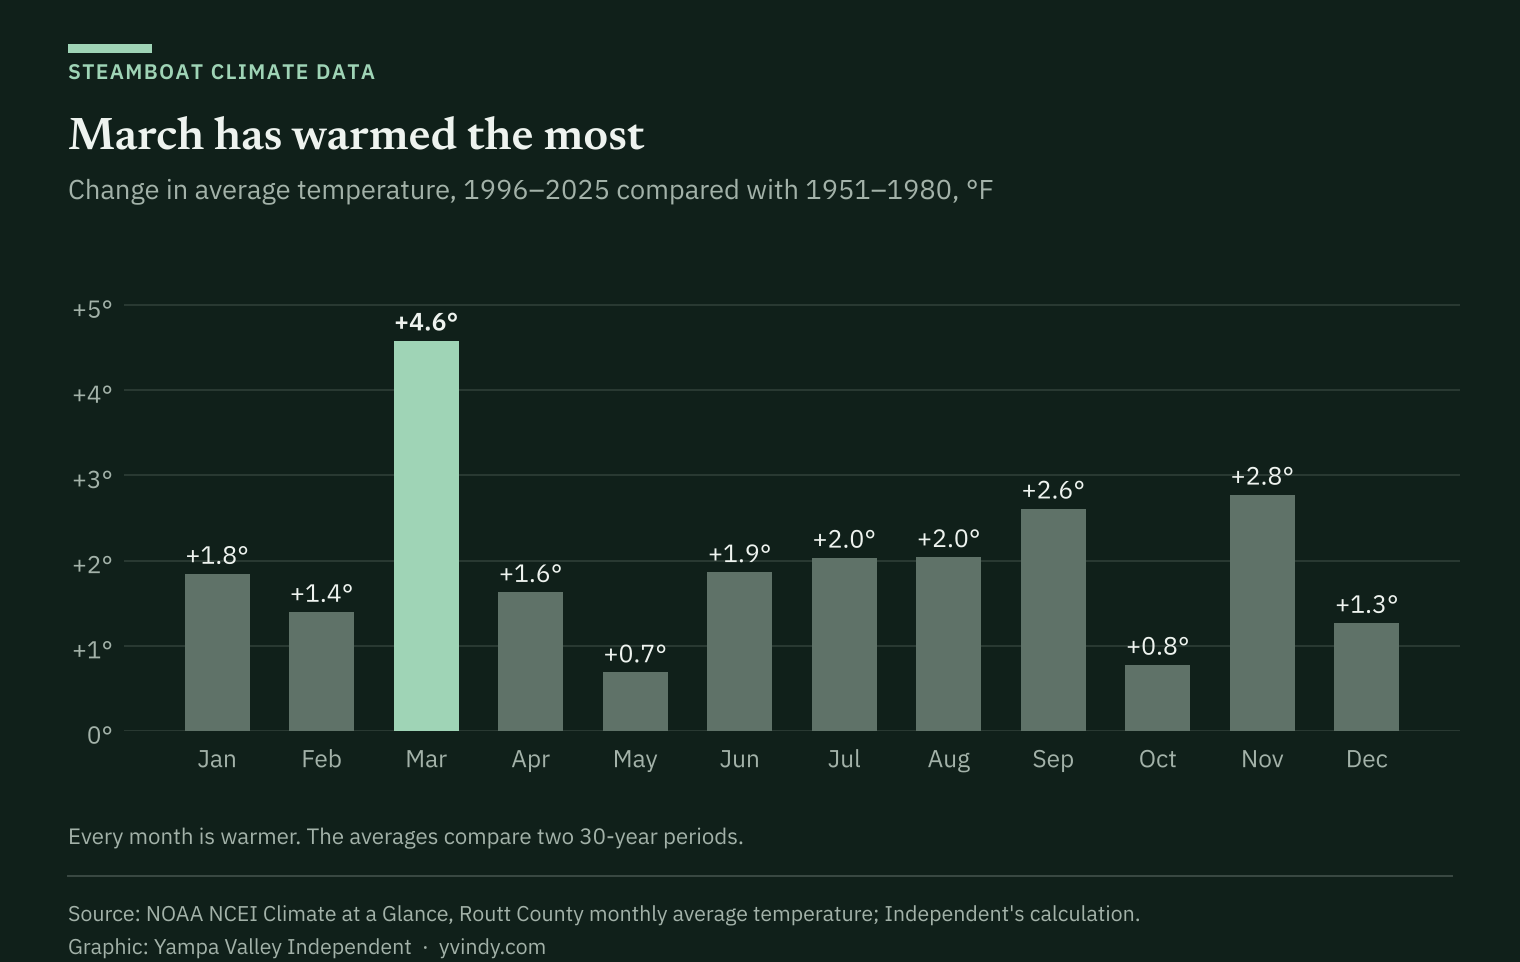
- The county's average temperature over the past 30 years, 40.4 degrees, is about 2 degrees higher than in 1951 to 1980. Every month has warmed, March the most.
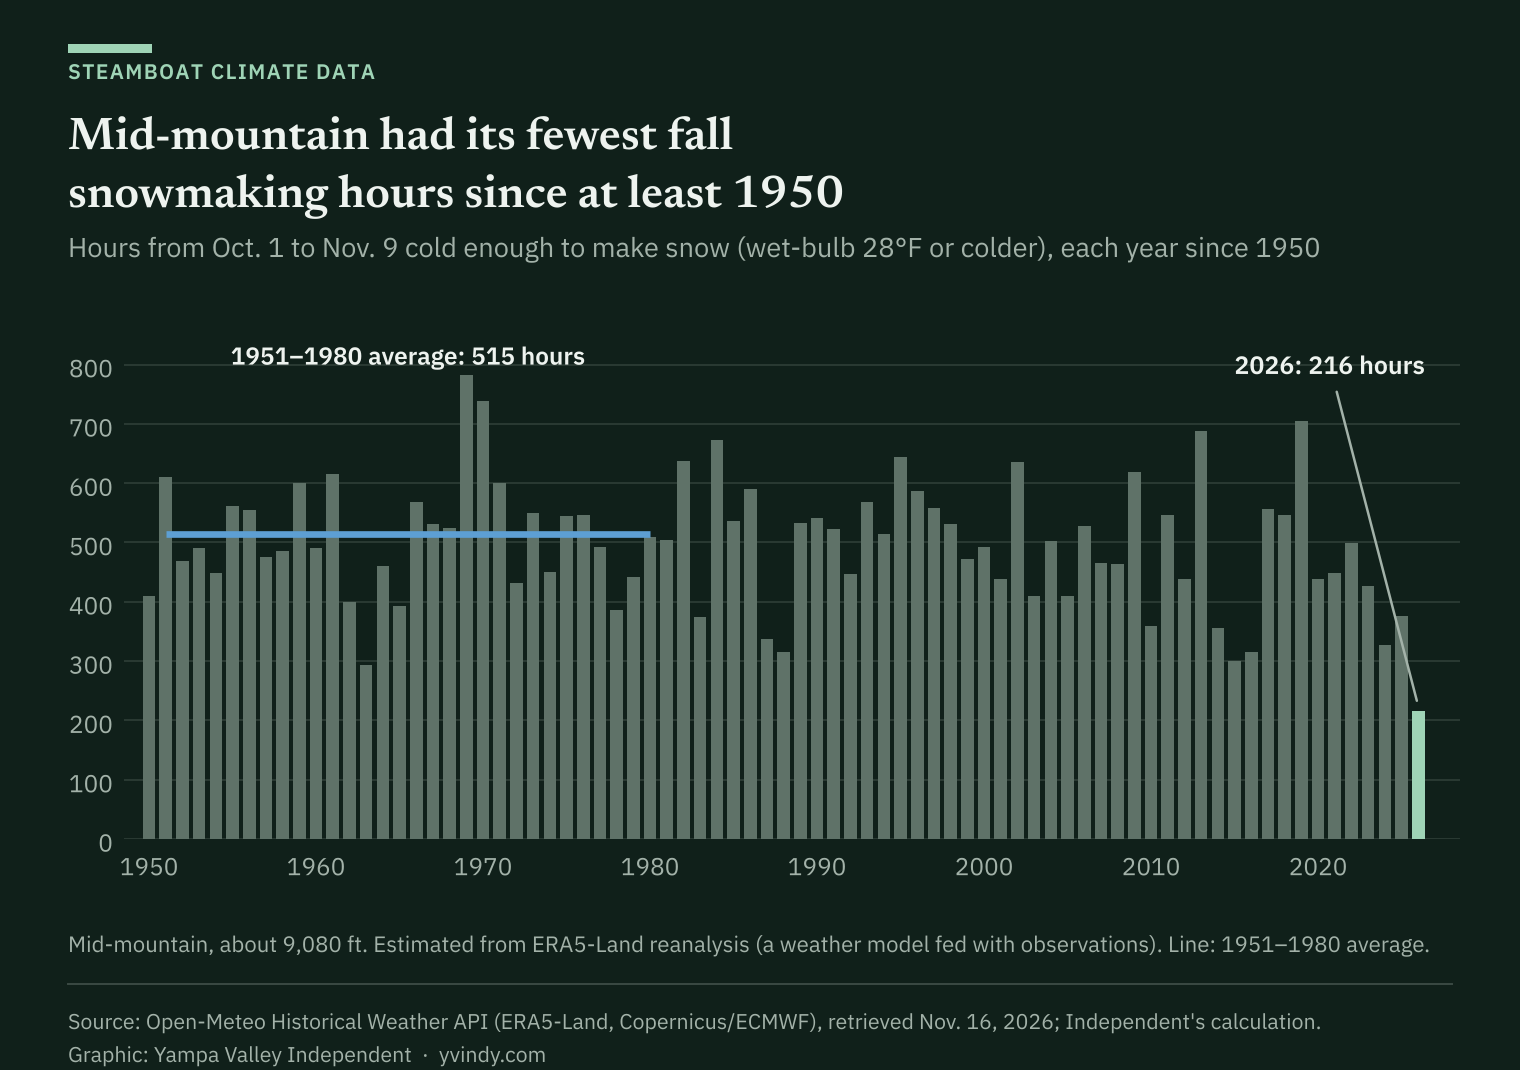
- From Oct. 1 to Nov. 9, mid-mountain at Steamboat had about 216 hours cold enough to make snow, the fewest of any fall since at least 1950 and less than half the 1951-to-1980 average, by the Independent's analysis of weather reanalysis data.
- On Buffalo Pass, the Dec. 1 snowpack has averaged nearly a third less over the past 20 years than in the 20 before. Lower sites show smaller declines that are not statistically significant.
- Seven climate models on a high-emissions pathway put Steamboat 2.5 to 3.9 degrees warmer, on average, in 2031 to 2050 than in 1991 to 2020.
Steamboat Resort is scheduled to open for the season Saturday after one of the poorest falls for making snow in more than 75 years.
From Oct. 1 through Nov. 9, the middle of the mountain, at about 9,080 feet, had roughly 216 hours cold and dry enough for snow guns to work, according to an analysis of hourly weather estimates by the Yampa Valley Independent. That is the fewest of any fall in a record that starts in 1950, and less than half the 1951-to-1980 average of 515 hours.
The summit had its fewest hours, too. In town, only 1988 had fewer.
A warm fall is weather. The longer record shows the climate it fits into. Through October, 2026 is the warmest year in 132 years of federal records for Routt County, and the county's average temperature has climbed about 2 degrees since the middle of the last century.
This is the first story in a series on how a changing climate could affect Steamboat's economy. This part sticks to the data: NOAA county temperatures back to 1895, hourly weather estimates back to 1950, 40 years of federal snow measurements and seven climate models that run to 2050. Later stories will look at what the trends could mean for jobs, taxes and the city's plans.
Warmer, every month
Routt County's average temperature from 1996 through 2025 was 40.4 degrees, about 2 degrees warmer than the 38.4-degree average from 1951 through 1980, NOAA's county records show. The past 10 years averaged 40.9 degrees.
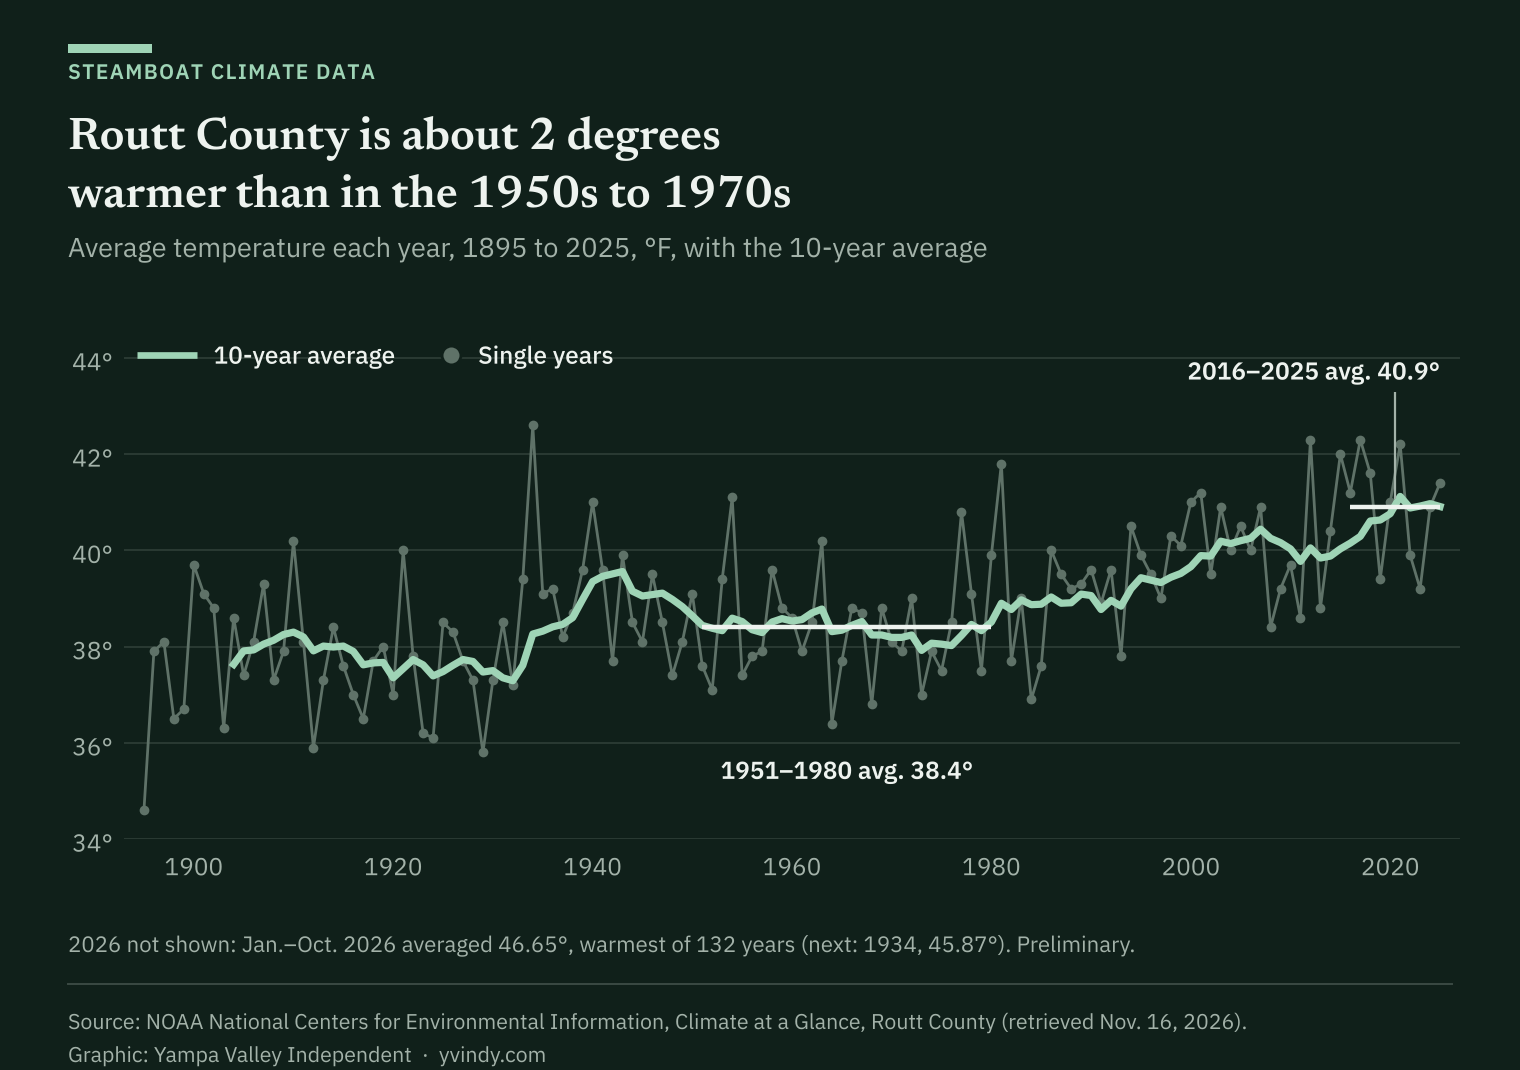
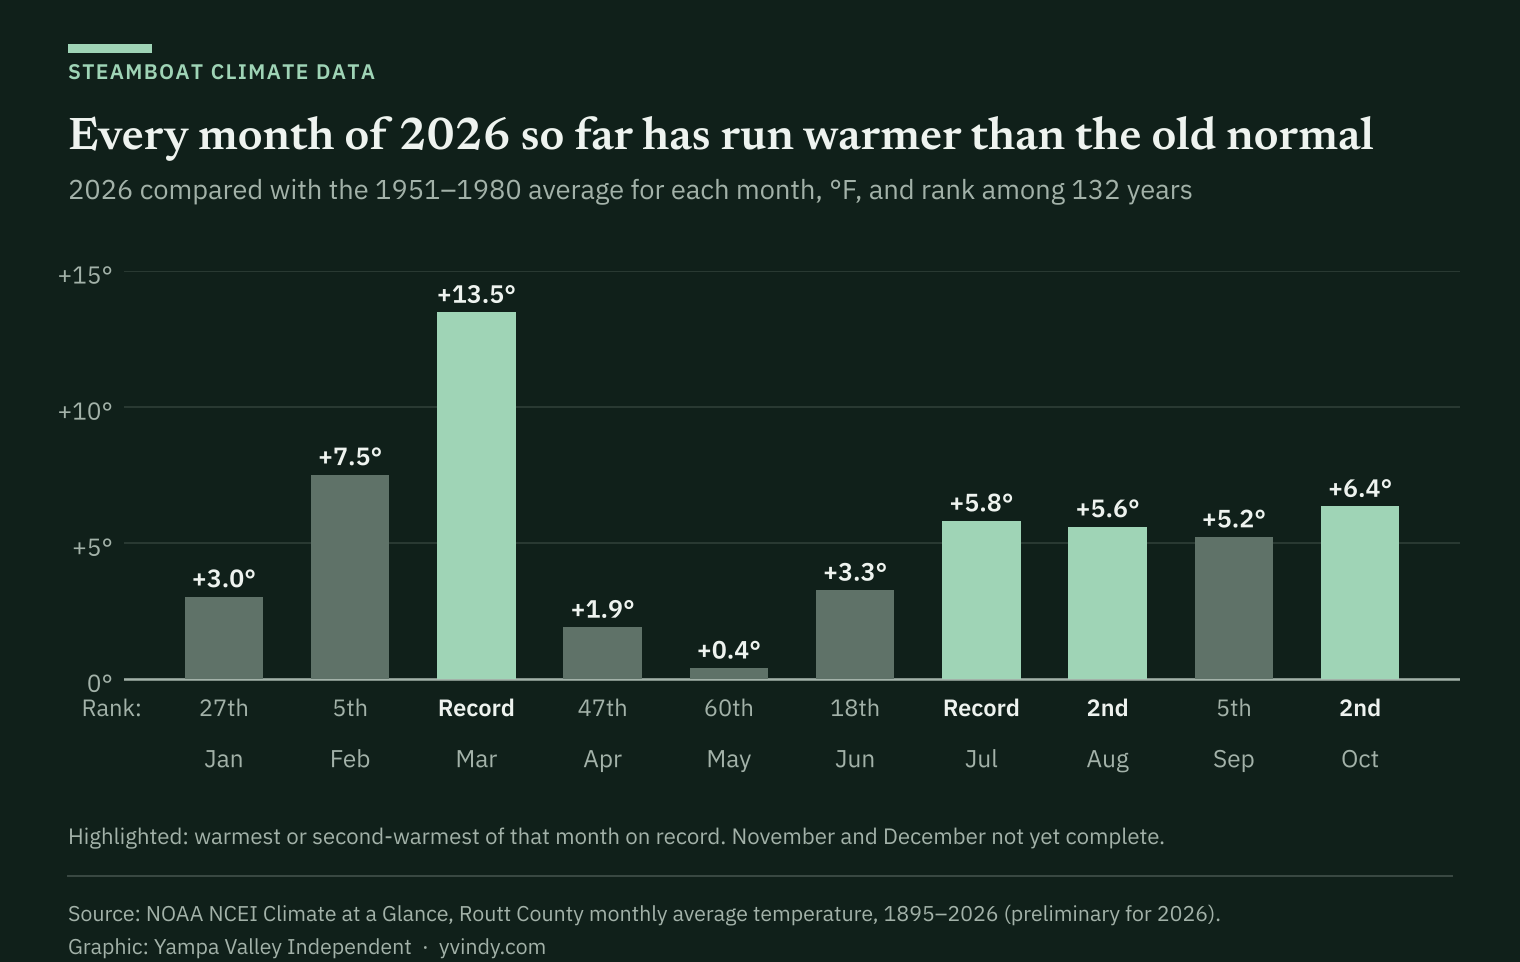
This year is running warmer still. January through October averaged 46.65 degrees, ahead of 1934's 45.87, the previous high for those months. March and July were each the warmest on record for that month; August and October were second. Every month from January through October was warmer than its 1951-to-1980 average. NOAA's figures for recent months are preliminary.
The warming shows up in every month, but not evenly. Comparing the past 30 years with 1951 to 1980, March warmed the most, 4.6 degrees, followed by November at 2.8 and September at 2.6. Over just the past 10 years, March ran 4.3 degrees warmer than in 1951 to 1980, and September and November each about 4.1.
That matches the statewide picture. Colorado warmed 2.3 degrees from 1980 to 2022, and fall warmed the most, 3.1 degrees, according to Climate Change in Colorado, a 2024 report for the Colorado Water Conservation Board by Becky Bolinger, Russ Schumacher and Peter Goble of the Colorado Climate Center at Colorado State University and Jeff Lukas of Lukas Climate Research and Consulting. The authors write that Colorado's observed warming is "strongly linked to the overall human influence on climate."
Less time to make snow
Snow guns work when the wet-bulb temperature, a measure that combines air temperature and humidity, is low enough. Park City Mountain in Utah needs a wet-bulb of 28 degrees to blow snow, public radio station KPCW reported last year.
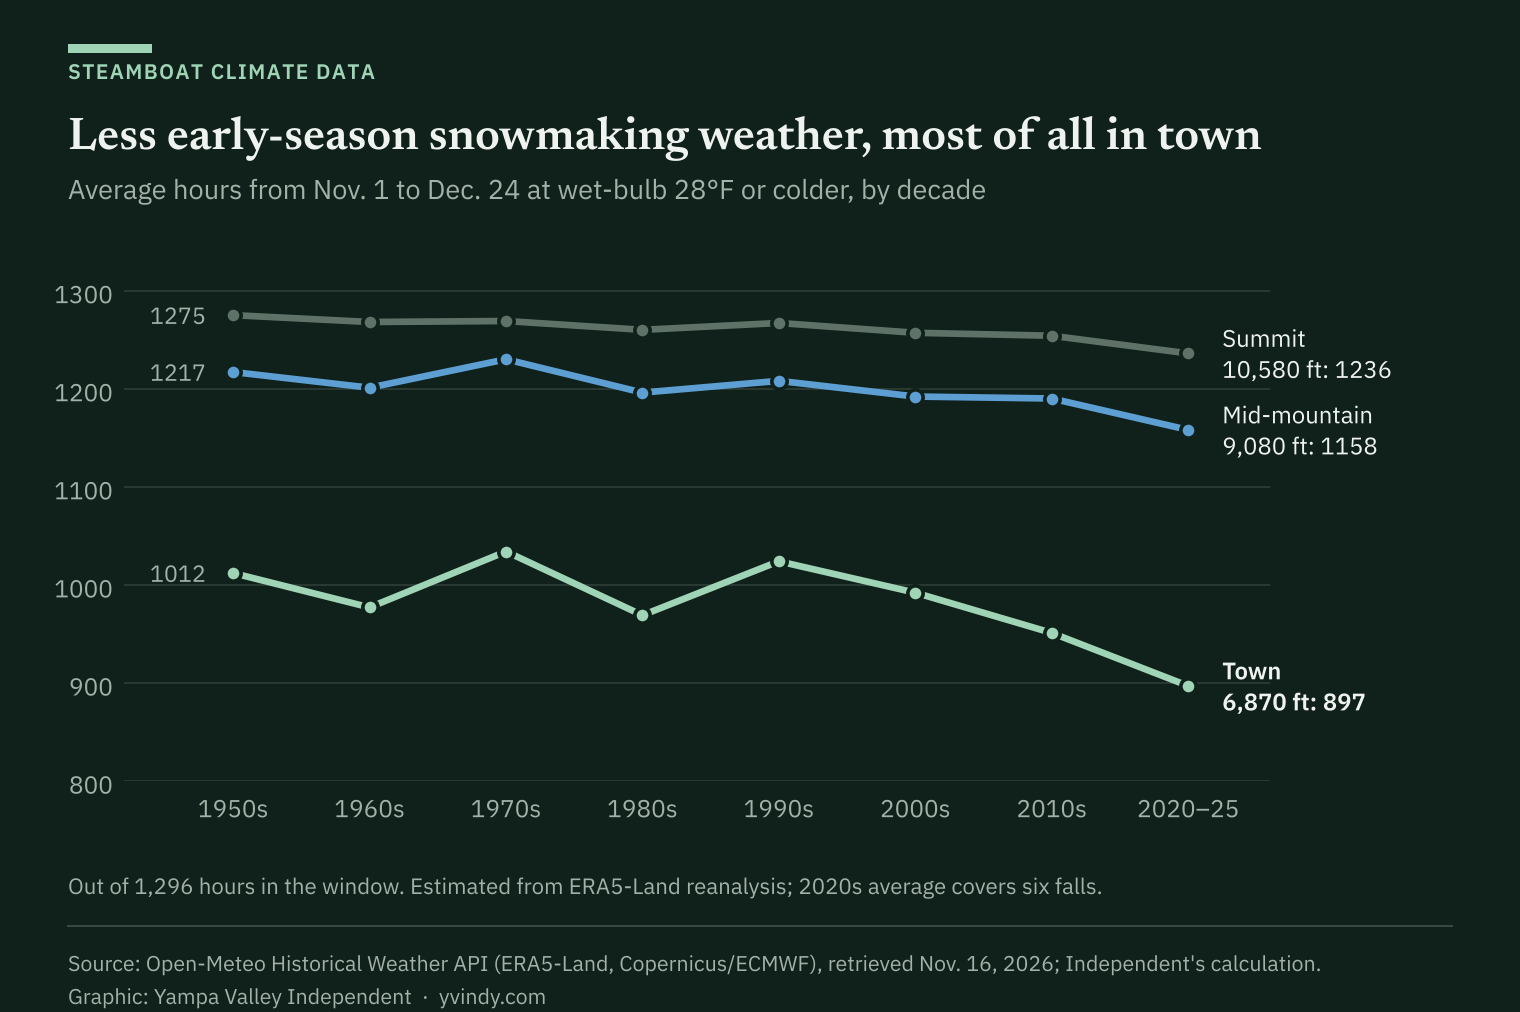
The Independent counted the hours at or below 28 degrees each fall since 1950 using ERA5-Land, a global reconstruction of past weather that blends observations into a weather model, supplied through Open-Meteo.¹ This fall stands out at every elevation: 216 hours at mid-mountain, 364 at the summit and 55 in town, against 1951-to-1980 averages of 515, 677 and 252 hours.
Over the long run, the change is gradual and largest at the bottom of the mountain. From Nov. 1 to Christmas Eve, the town averaged 962 hours at or below 28 degrees from 1996 through 2025, about 4.5% fewer than from 1951 through 1980, and the past six falls averaged 897, 11% fewer than in the 1950s. Mid-mountain and the summit lost less. The downward trend is statistically significant only at the summit.
Measured temperatures back up this fall's estimates. Federal snow stations at Tower, on Buffalo Pass, and at Dry Lake, on the lower Buffalo Pass road, recorded their warmest Oct. 1 to Nov. 9 since at least 1985: 37.0 degrees at Tower and 42.9 at Dry Lake, both topping 2016. Tower's temperature record has gaps, and the Natural Resources Conservation Service warns that SNOTEL air temperatures carry a known sensor bias.
Early-season snow
The clearest measured change in early-season snow is high on Buffalo Pass. At the federal Tower station, at 10,610 feet, the snowpack on Dec. 1 held an average of 8.1 inches of water from 2006 through 2025, down from 11.8 inches from 1986 through 2005, about 31% less. The snowpack on Nov. 21 and Dec. 15 shows similar drops, 29% and 26%. The declines are statistically significant even with last winter's record-low Dec. 1 reading left out.
Less fall precipitation is part of it. Tower's gauge caught about 15% less from Oct. 1 to Dec. 1 in the later 20 years.
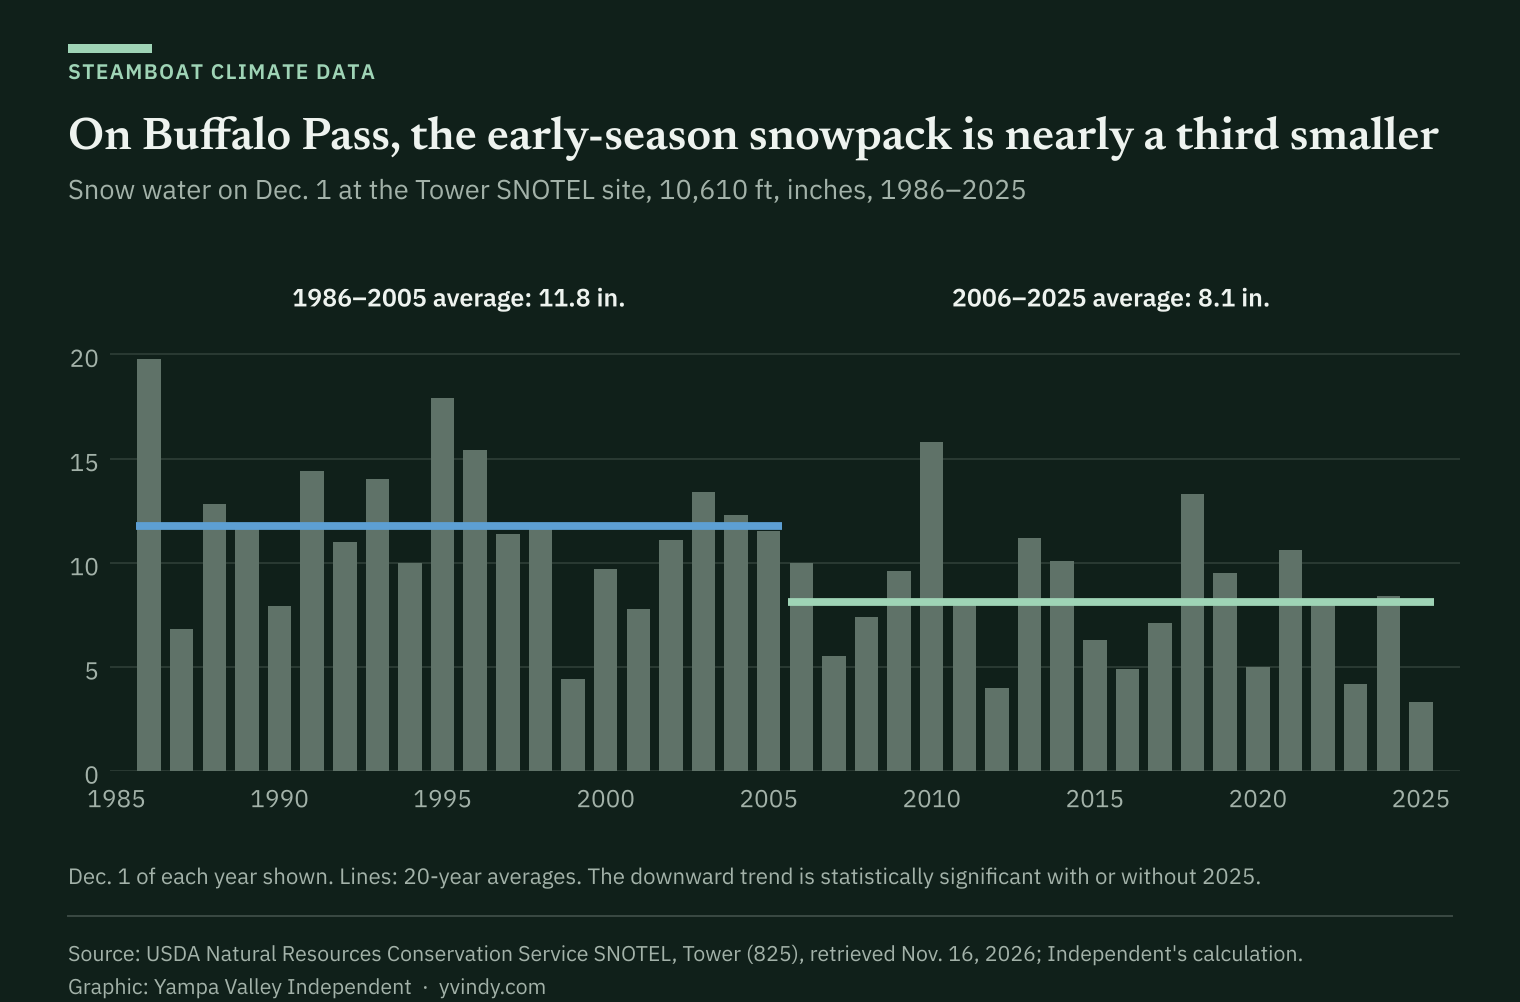
Lower sites show smaller changes. The Dec. 1 snowpack fell 21% at Rabbit Ears, at 9,400 feet, and 15% at Dry Lake, at 8,240 feet, but neither decline is statistically significant.

Spring, and more days above freezing
On the mountain, winter days above freezing are adding up. From November through April, mid-mountain averaged 54 days with highs above 32 degrees in 1951 to 1980 and 65 days in 1996 to 2025, according to the ERA5-Land estimates. The past 10 seasons, through last winter, averaged 73, and last winter had 115, the most since at least 1951.
The same data estimate that mid-mountain's snow depth on April 15 fell 18% between those two periods, from 43 inches to 35, and that the snow melted out about six days earlier. Those are model estimates: they read lower than measured snow but track year-to-year swings at the federal snow stations closely.

At Tower, the measured snowpack on May 1 averaged 12% less in the past 20 years than in the 20 before, a decline just short of statistical significance.
What the climate models show
Climate models point to more warming. The Independent pulled seven high-resolution models from CMIP6, the international model comparison that feeds United Nations climate assessments, through Open-Meteo, which adjusts each model to match ERA5-Land's local climate. Open-Meteo says the runs are "as close to RCP8.5 as possible," a high-emissions pathway.²
Run over the past, the seven models warmed Steamboat 1.3 to 2.2 degrees between 1951-1980 and 1996-2025, in line with the roughly 1.7 degrees in the ERA5-Land estimates and 2 degrees in NOAA's county record.
For 2031 through 2050, the models put Steamboat's average temperature 2.5 to 3.9 degrees above the 1991-to-2020 average, with a middle estimate of 3 degrees. Every month warms. In the middle estimate, July warms the most, 4 degrees, and October 3.7; summer as a whole warms 3.6 degrees and November 2.9. Winter and March warm about 2.2.

In the 2040s, the models' average yearly temperature in town runs from 43 to 45 degrees, 2.8 to 4.7 degrees above their 1991-to-2020 average, with a middle estimate of 3.8. Over the past 30 years, the ERA5-Land estimate averaged 40.8.

On the mountain, the models add 7 to 21 days above freezing between November and April by 2031 to 2050, with a middle estimate of about 18, on top of 59 to 68 such days a season in their 1991-to-2020 runs.

Colorado's climate report, using a medium-low emissions scenario, projects the state 2.5 to 5.5 degrees warmer in 2035 to 2064 than in 1971 to 2000, or 1 to 4 degrees warmer than today, with April 1 snowpack 5% to 30% lower in most projections for the state's major river basins.³
The same report says global emissions through 2022 tracked that medium-low pathway, about 20% below what the high-emissions pathway assumed for 2022, and that current policies point well below the high-emissions path.
For ski areas, the timing matters. A 2011 U.S. Geological Survey study of the Yampa River basin at Steamboat Springs, the East River basin above Almont in Gunnison County and a ski area in each, by William Battaglin, Lauren Hay and Steven Markstrom, found projected snowpack decreases "most dramatic during fall and spring." It projected only small changes in March snow cover at both ski areas until around 2050, with larger decreases possible after that and a wide range of outcomes.⁴
What the data can't say
- One warm fall is not a trend. The long-term decline in early-season snowmaking hours is modest, and its downward trend is statistically significant only at the summit.
- The hourly estimates come from a weather model with a grid about 6 miles across. It smooths the mountain's terrain and can miss the cold air that pools in the valley on clear nights.
- In town, the National Weather Service's cooperative observer has recorded no long-term decline in days with snow on the ground in November or April.
- The snowpack comparisons cover the 40 winters all three federal stations share, starting in 1986-87. Tower's longer record, from the early 1980s, shows a steeper Dec. 1 decline.
- Climate models carry wide ranges, and the high-emissions pathway used here runs above what emissions so far and current policies point to, according to the CSU report.
What's next
Steamboat Resort is scheduled to open Saturday, Nov. 21. The next story in this series will look at how much of Steamboat's economy, from sales tax to jobs, rides on the winter season.
How we did this
The Independent downloaded the data on Nov. 16, 2026, and did every calculation in Python.
- Temperature: NOAA's Climate at a Glance county series for Routt County, 1895 through October 2026, built from adjusted station records (preliminary for recent months).
- Hourly weather, 1950 to Nov. 9, 2026: ERA5-Land reanalysis from the European Union's Copernicus Climate Change Service, through Open-Meteo's historical weather service under the Independent's paid plan, at three points: town (6,870 feet), mid-mountain (9,080 feet) and the summit (10,580 feet). Snowmaking hours are hours with a wet-bulb temperature of 28 degrees or colder. The data stop at Nov. 10, so this fall's comparison runs through Nov. 9 for every year.
- Snowpack: daily records from the Natural Resources Conservation Service's SNOTEL stations at Tower, Rabbit Ears and Dry Lake. "Statistically significant" means a straight-line trend from the 1986-87 through 2025-26 winters that would be unlikely (under a 5% chance) if there were no real trend.
- Town snow: daily snow depth from the National Weather Service cooperative station in Steamboat Springs, through the NOAA Regional Climate Centers' ACIS service.
- Climate models: seven CMIP6 models through Open-Meteo's climate service (footnote 2). Changes compare 20-year averages for 2031-2050 with 1991-2020.
The data files and scripts are available on request.
Footnotes
- ERA5-Land, Copernicus Climate Change Service (C3S) and the European Centre for Medium-Range Weather Forecasts, via Open-Meteo (CC BY 4.0). Weather data by Open-Meteo.com.
- CMIP6 High Resolution Model Intercomparison Project (HighResMIP) models: CMCC-CM2-VHR4 (CMCC Foundation, Italy), EC-Earth3P-HR (EC-Earth consortium, Europe), FGOALS-f3-H (Chinese Academy of Sciences), HiRAM-SIT-HR (Academia Sinica, Taiwan), MPI-ESM1-2-XR (Max Planck Institute for Meteorology, Germany), MRI-AGCM3-2-S (Meteorological Research Institute, Japan) and NICAM16-8S (JAMSTEC and MIROC, Japan). Open-Meteo applies a linear monthly bias correction onto ERA5-Land, which it says does not change the climate-change signal. CMIP6 model output is licensed under CC BY 4.0. Model years are simulations, not forecasts of any single year.
- Bolinger, R.A., J.J. Lukas, R.S. Schumacher and P.E. Goble, 2024: Climate Change in Colorado, 3rd edition. Colorado State University, https://doi.org/10.25675/10217/237323.
- Battaglin, W., L.E. Hay and S.L. Markstrom, 2011: Simulating the potential effects of climate change in two Colorado basins and at two Colorado ski areas. Earth Interactions 15(22), https://doi.org/10.1175/2011EI373.1.