
The pandemic-era housing frenzy has cooled in Routt County: Homes for sale have nearly tripled since 2021
Listing, Census and federal price data show more homes waiting for buyers, prices leveling off, more residents moving away and fewer single-family permits this year.

Key points
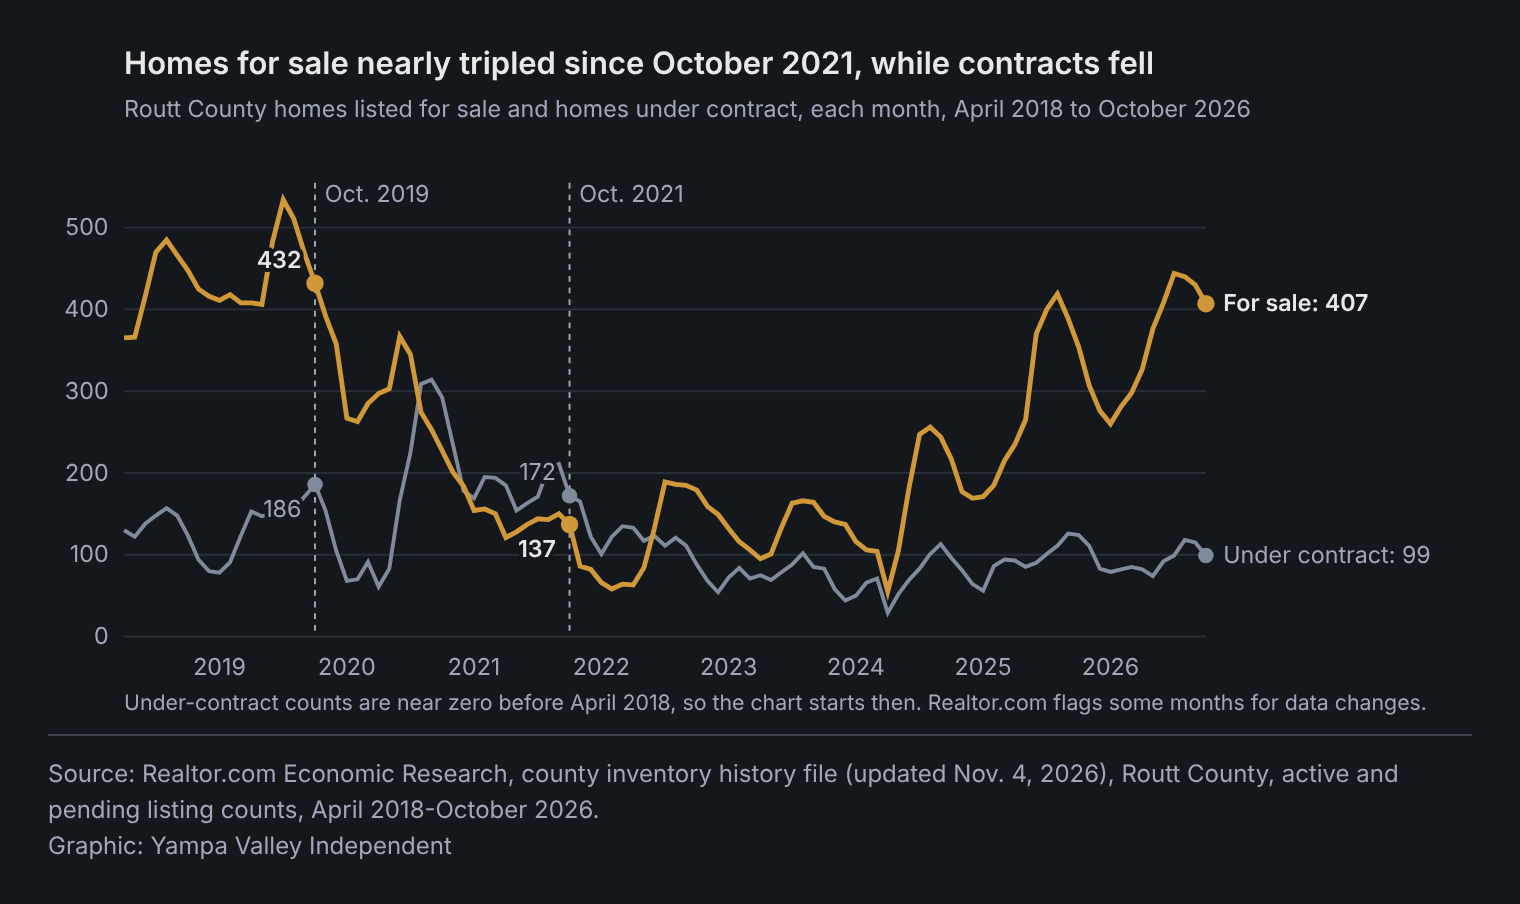
- In October, Realtor.com counted 407 Routt County homes for sale, nearly three times the 137 of October 2021 and close to the 432 of October 2019. Homes under contract numbered 99, down from 172 in 2021 and 186 in 2019.
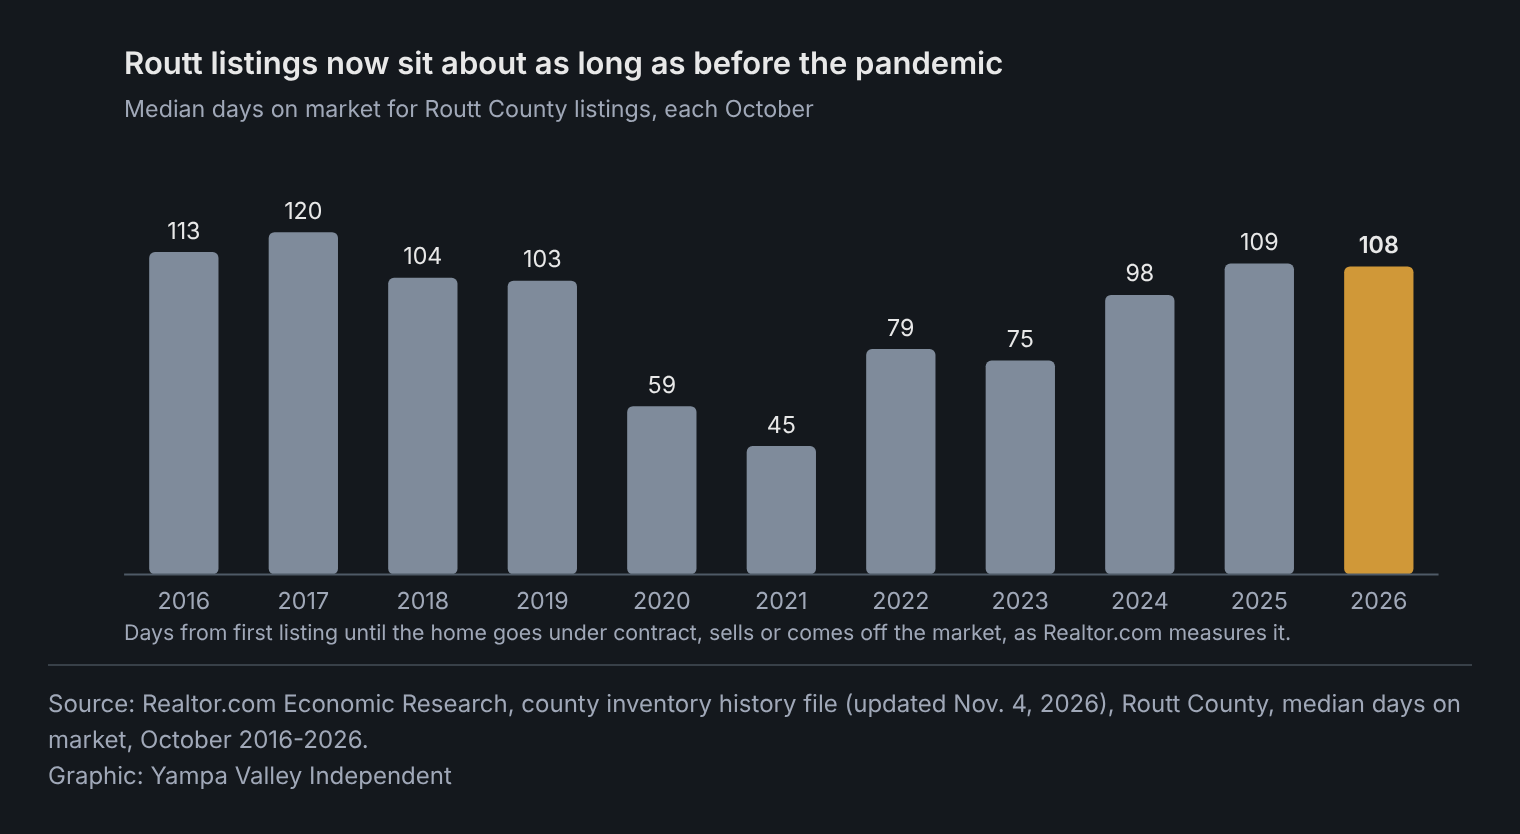
- The rise isn't a wave of new sellers. Realtor.com counted 48 newly listed Routt homes in October, down from 68 in October 2021, while the typical listing had been on the market 108 days, up from 45.
- A federal home price index for Routt dipped 0.6% in 2025, its first yearly decline since 2012, after rising 76% from 2019 to 2024, by the Independent's calculation. It leaves out cash and jumbo-loan sales; at the top of the market, county records show One Steamboat Place condos selling for a median $2,044 a square foot this year, nearly double 2021's $1,094.
- More people moved from Routt County to elsewhere in the U.S. than moved in for four straight years, Census estimates show, and the county's population dipped by 142 in the year ended July 1, 2025.
- Preliminary Census figures show permits for single-family and other one-unit homes in Routt fell 23% in the first nine months of 2026, while total units rose 17% because of two large buildings. Over 2021-2025, Routt permitted more housing per resident than eight of 10 other Western ski counties.
In October 2021, Routt County had 137 homes listed for sale, and buyers had even more than that, 172, tied up in pending contracts.
This October, 407 homes were for sale, nearly three times as many. Only 99 were under contract, and the typical listing had been on the market 108 days, up from 45.
The figures, from Realtor.com's monthly listing data, are one of several measures showing that the pandemic-era housing frenzy has cooled in the Steamboat area. A federal home price index for the county dipped in 2025 for the first time since 2012. More people have moved out of Routt County than in for four years running. And preliminary permit figures show fewer new single-family homes this year.
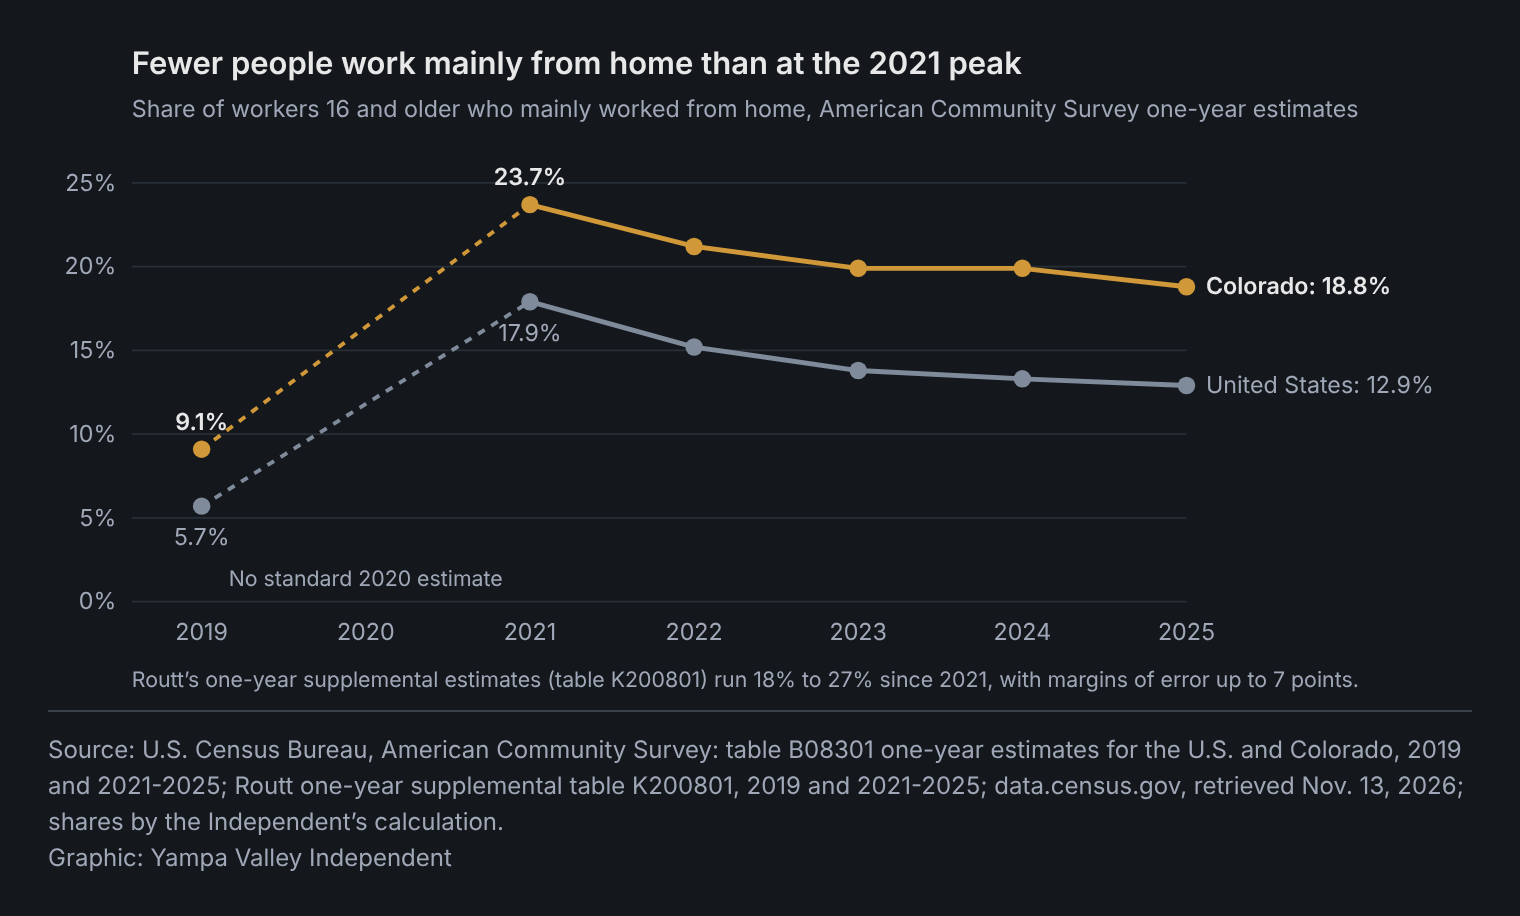
Nationally, fewer people work mainly from home than at the 2021 peak, though the Census figures for Routt are too uncertain to show whether that has happened here.
The data show what changed, not why.
More homes, fewer contracts
Routt County's count of homes for sale is back near where it stood before the pandemic: Realtor.com counted 432 listings in October 2019. What's different is the pace. In October 2019, 186 homes were under contract, nearly twice this October's 99, though Realtor.com's under-contract counts depend on how local listing services report pending sales.
The buildup doesn't come from a rush of sellers. Realtor.com counted 48 newly listed homes in Routt in October, fewer than the 68 of October 2021 and the 96 of October 2019. With fewer homes coming on the market than in 2021, the larger count reflects homes staying on the market longer.
And homes cost far more. Realtor.com's median asking price per square foot in Routt was $794 in October, more than double the $366 of October 2019. That's about the same as a year earlier, $793, and down from a peak of $924 in January 2025.
The cooling isn't Routt's alone. Nationwide, Realtor.com counted about 1.18 million homes for sale in October, roughly double October 2021 and close to October 2019's 1.21 million. Among 11 Western ski counties the Independent compared, Routt's growth in listings since October 2021 was among the largest, along with Grand County (Winter Park), Utah's Wasatch and Summit counties and Gunnison County. Pitkin County (Aspen) held about even.
Remote work: down nationally, unclear in Routt
In 2021, 17.9% of U.S. workers said they mainly worked from home, up from 5.7% in 2019, according to the Census Bureau's American Community Survey. By 2025, the share had fallen to 12.9%.
Colorado followed the same path at a higher level: 9.1% in 2019, 23.7% in 2021 and 18.8% in 2025. Even so, the state's share is still twice what it was before the pandemic.
For Routt, the bureau's one-year supplemental estimates put the share at 16.5% in 2019 and between about 18% and 27% in each year since 2021, including 19.9% in 2025. Their margins of error, as much as 7 percentage points either way, are too wide to show a trend.
More residents moving away
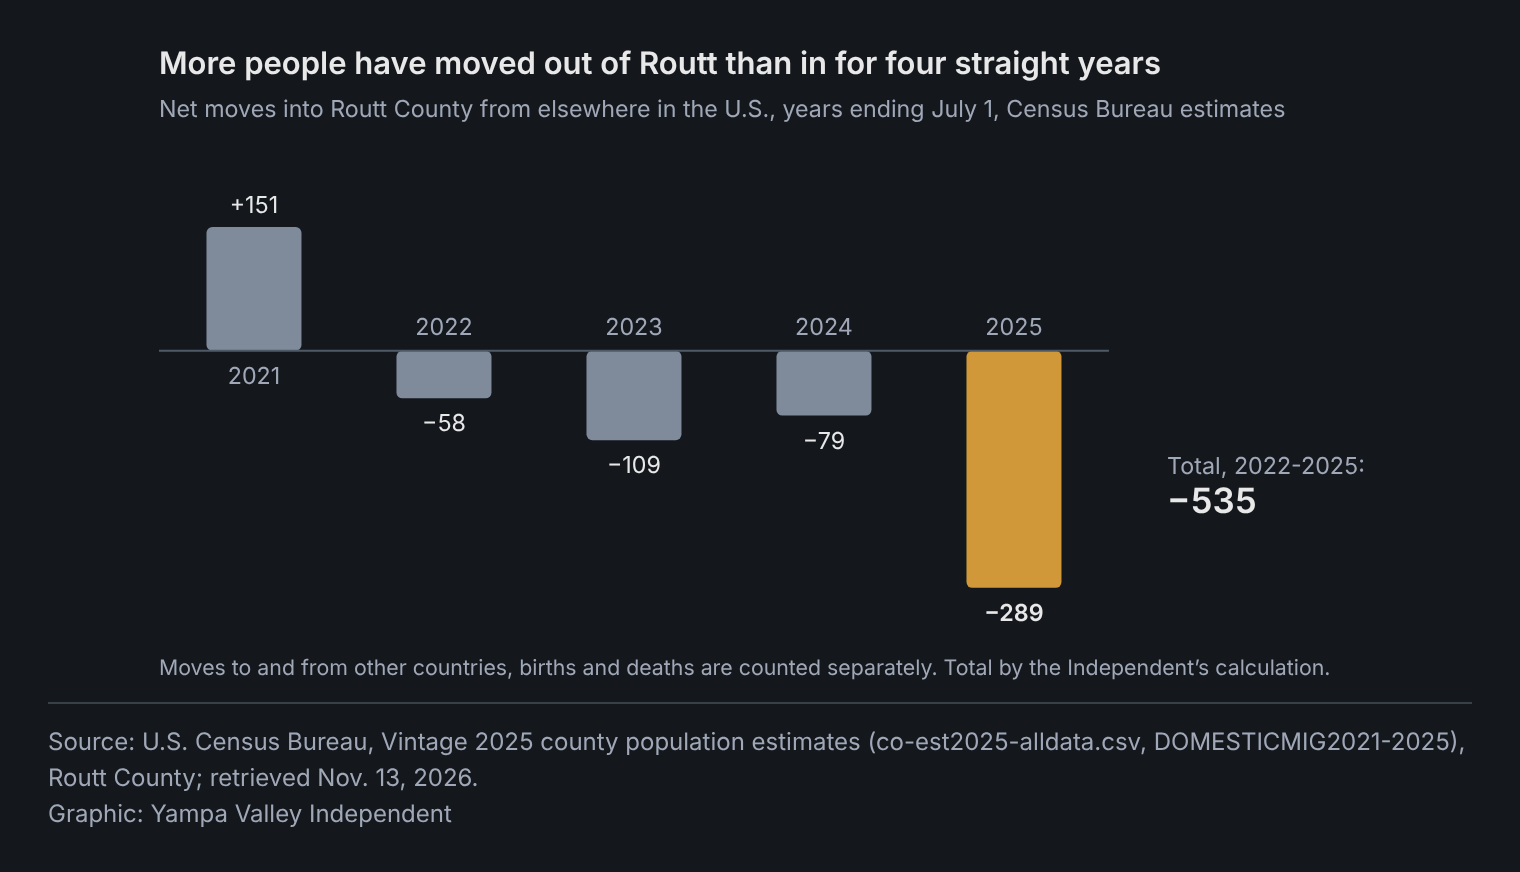
Census population estimates show Routt gained a net 151 residents from moves within the U.S. in the year that ended July 1, 2021. In each of the four years since, more people left for other parts of the country than arrived: a net 58, 109, 79 and, in the year ended July 1, 2025, 289.
In the bureau's previous series of estimates, Routt gained from such moves every year from 2013 through 2018, by 116 to 338 people a year, then lost 30 and 92 in 2019 and 2020. The two series aren't directly comparable.
More births than deaths and arrivals from abroad offset part of that. The county's estimated population still fell by 142 in that latest year, to 25,329.
Routt has company. Nine of the 11 ski counties in the comparison lost more residents to moves within the U.S. than they gained in the year ended July 1, 2025; only Grand County and Utah's Wasatch County gained. Colorado as a whole lost a net 12,100 people to other states that year, its first loss in the bureau's estimates for the 2020s.
Prices flatten after a 76% run
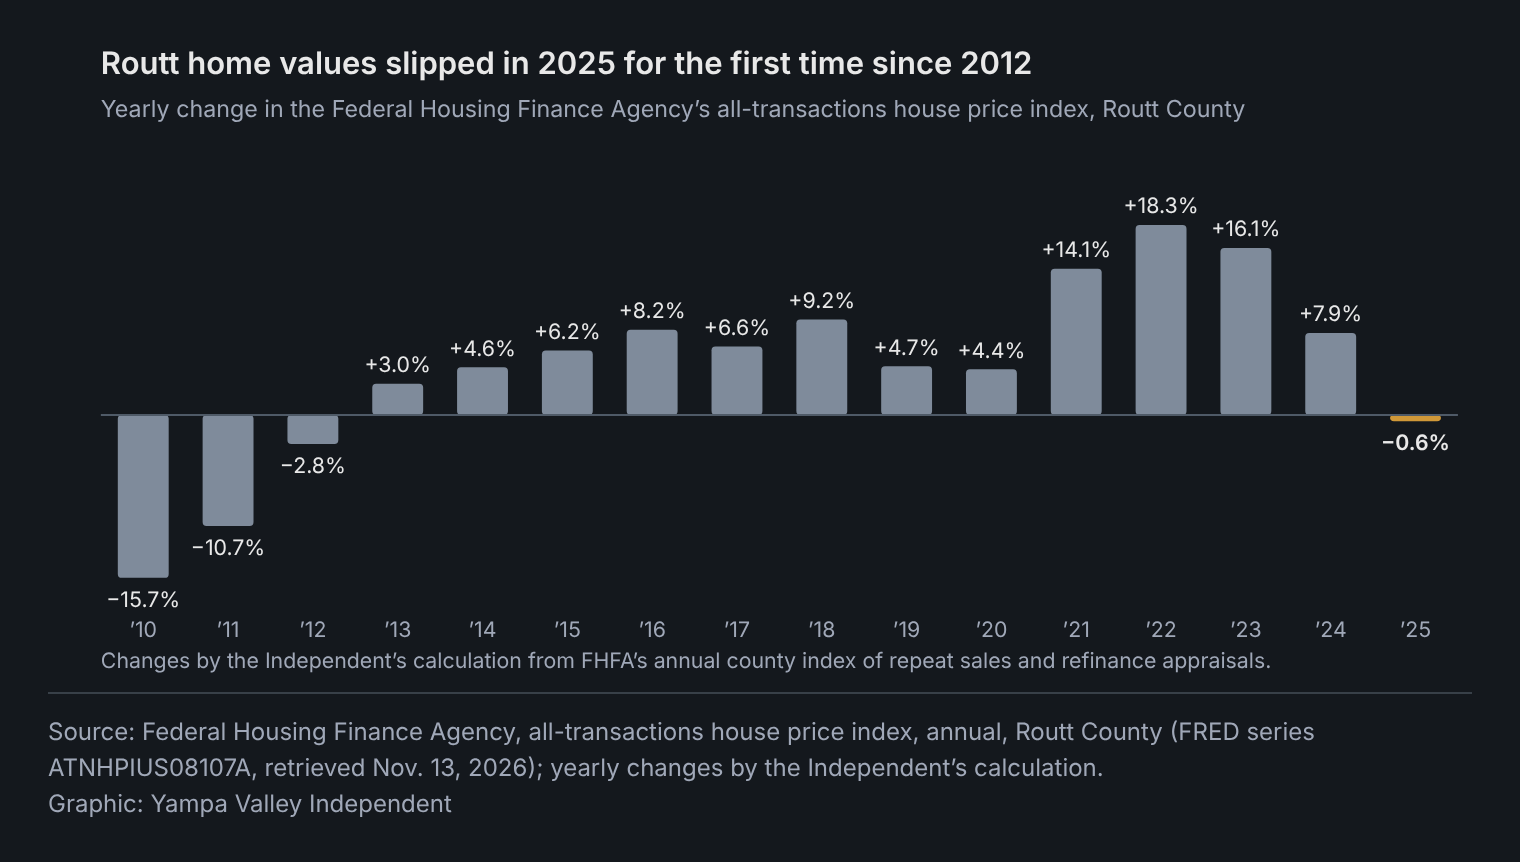
The Federal Housing Finance Agency's index of Routt home values, built from repeat sales and refinance appraisals of the same houses, rose 76% from 2019 to 2024, by the Independent's calculation. In 2025 it slipped 0.6%, close to flat but its first yearly drop since 2012. The index is built from mortgages that Fannie Mae and Freddie Mac buy or guarantee, so it doesn't count cash sales or homes bought with larger jumbo loans.
Pitkin (Aspen) and Eagle (Vail) counties also fell in 2025, by 4.8% and 1.3%. Of the seven other ski counties whose indexes the Independent retrieved, the index rose in the other five, led by Gunnison County's 8.6%.
At the top, prices hold far above pre-pandemic levels
The federal index leaves out cash sales and jumbo loans, so it says little about the top of the market. Sales recorded with the Routt County assessor fill in part of that picture.
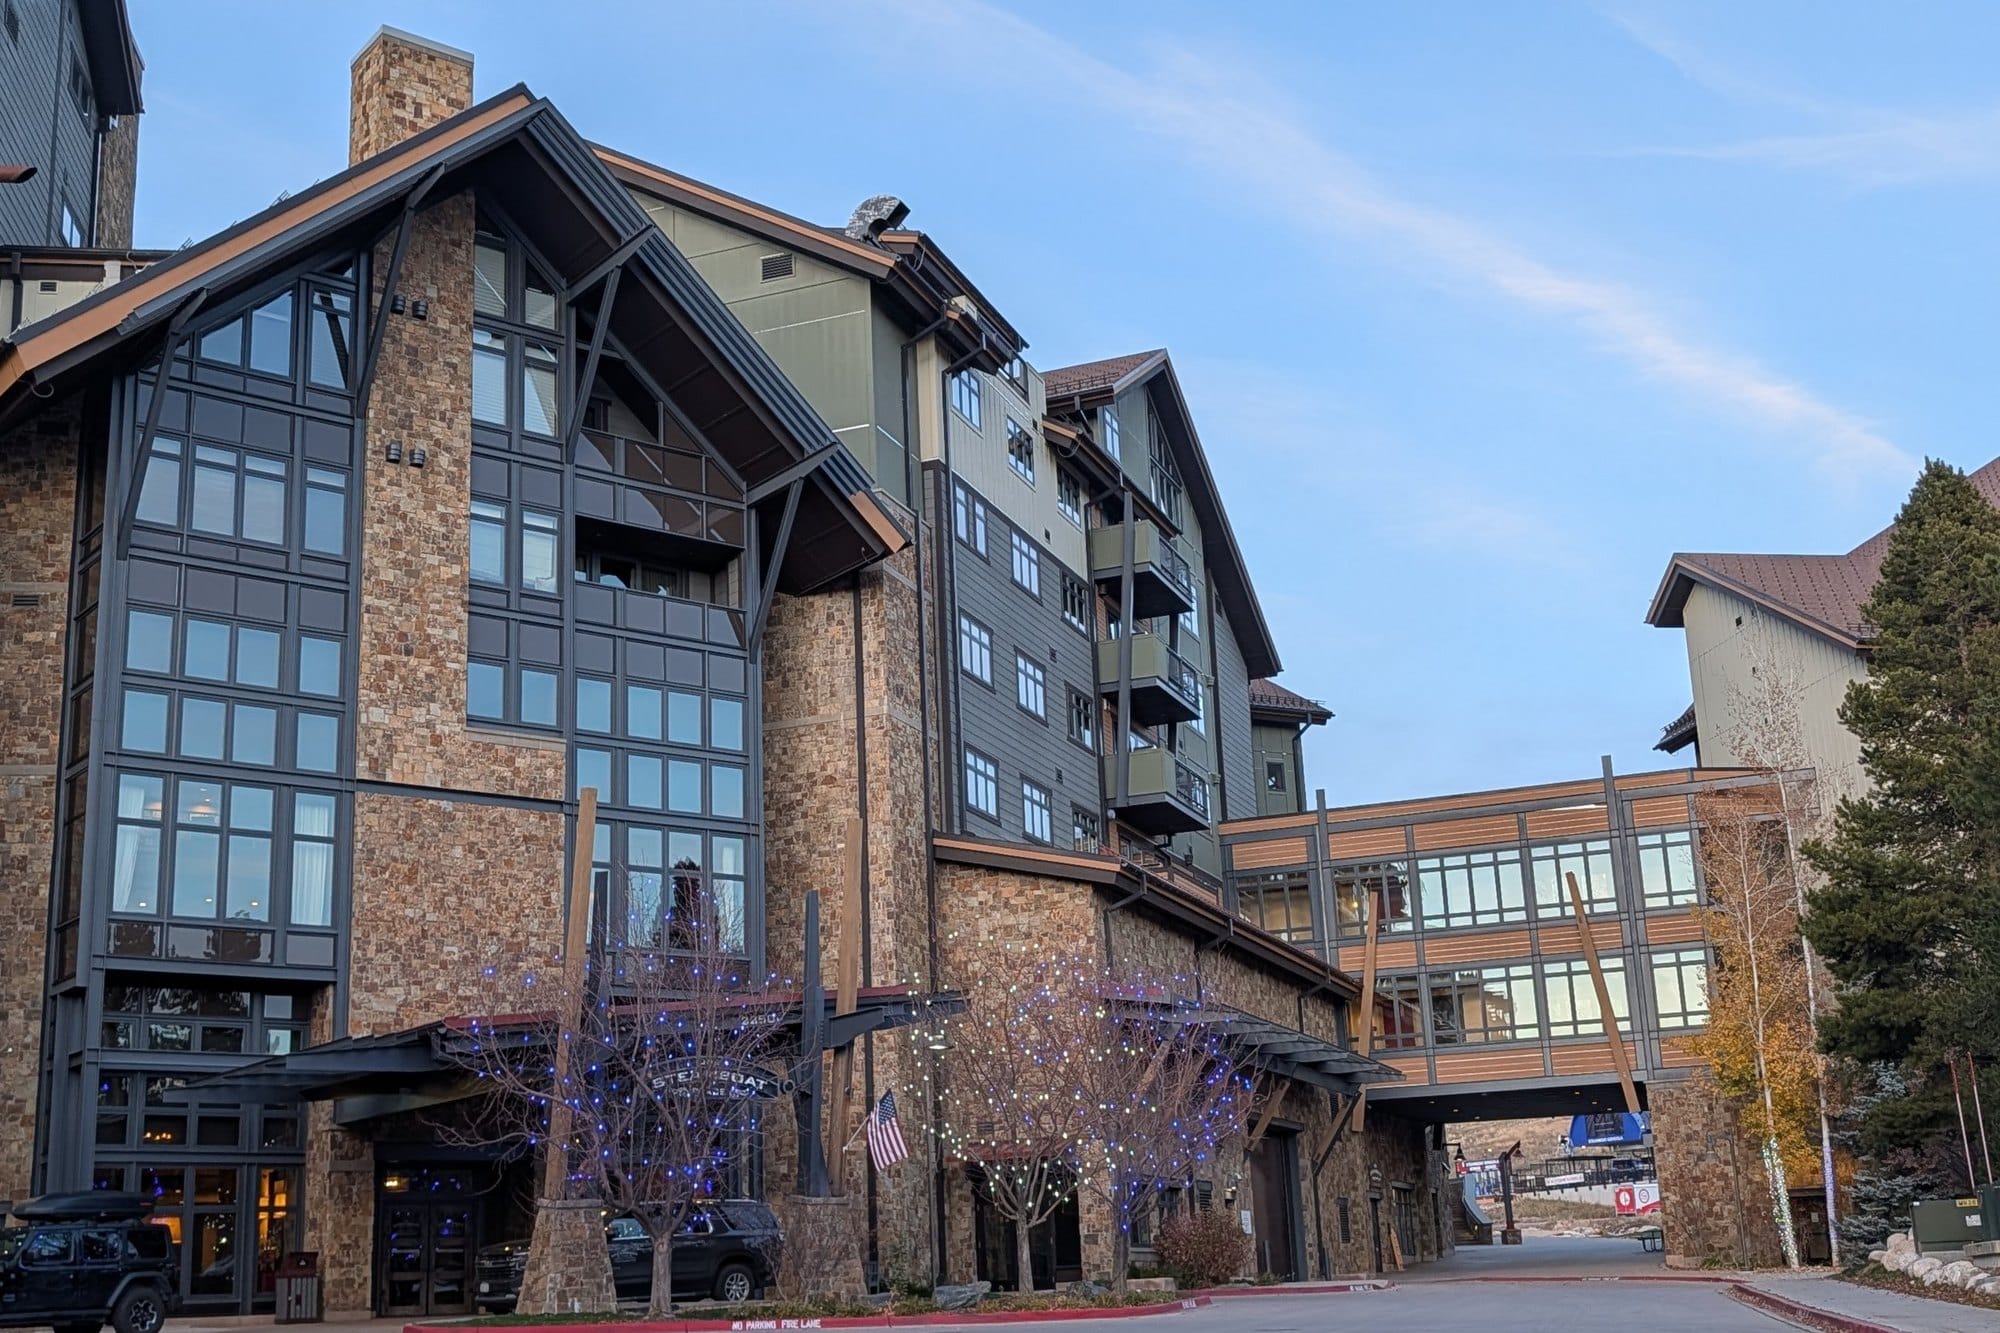
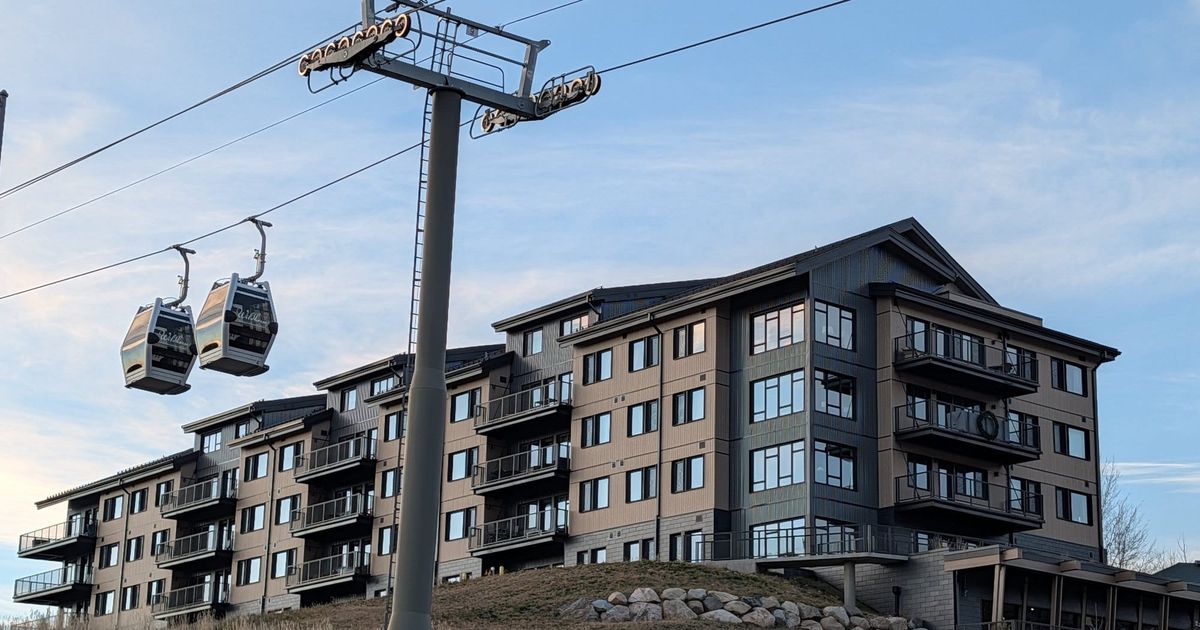
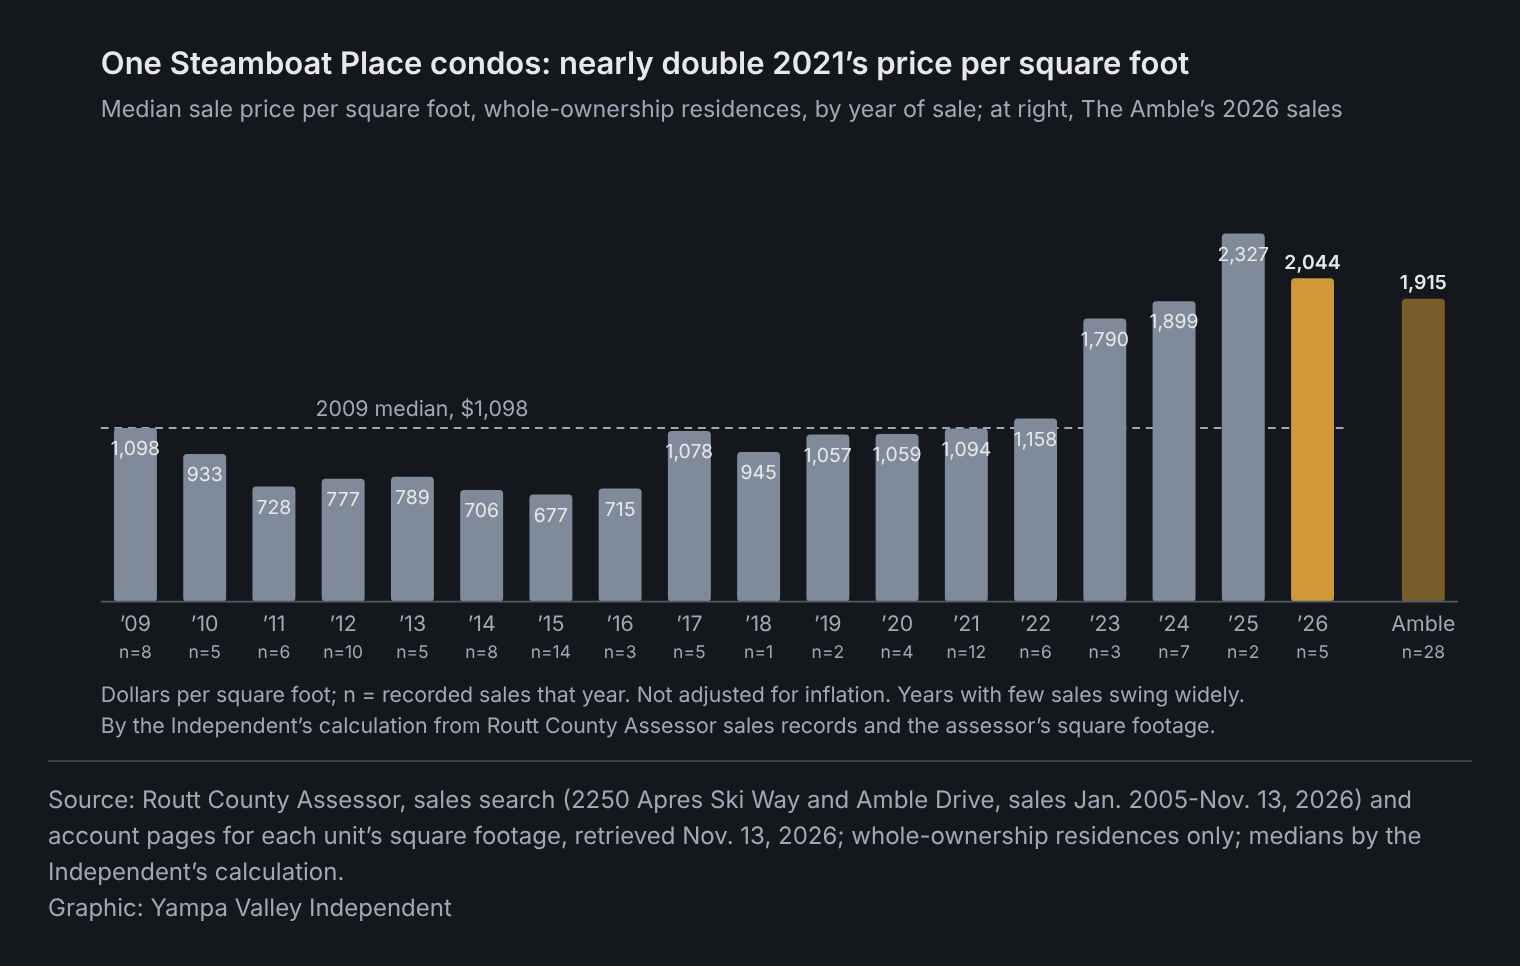
At One Steamboat Place, the slopeside condominium building at the gondola, whole-ownership residences that first sold in late 2009 went for a median of $1,098 a square foot that year, by the Independent's calculation from the assessor's records. The median fell to $677 by 2015 and didn't top its 2009 level again until 2022. The five sales recorded this year have a median of $2,044 a square foot, compared with $1,094 in 2021. The figures aren't adjusted for inflation, and several years had only a few sales.
One residence there sold for $2.85 million in November 2009, $4.775 million in September 2024 and $6.1 million in February 2026, the county's records show.
The Amble, a new condominium building at the base, recorded 28 sales from April through September totaling $88.2 million, at a median of $1,915 a square foot using the assessor's square footage.
Building: single-family permits down this year, not behind other ski towns
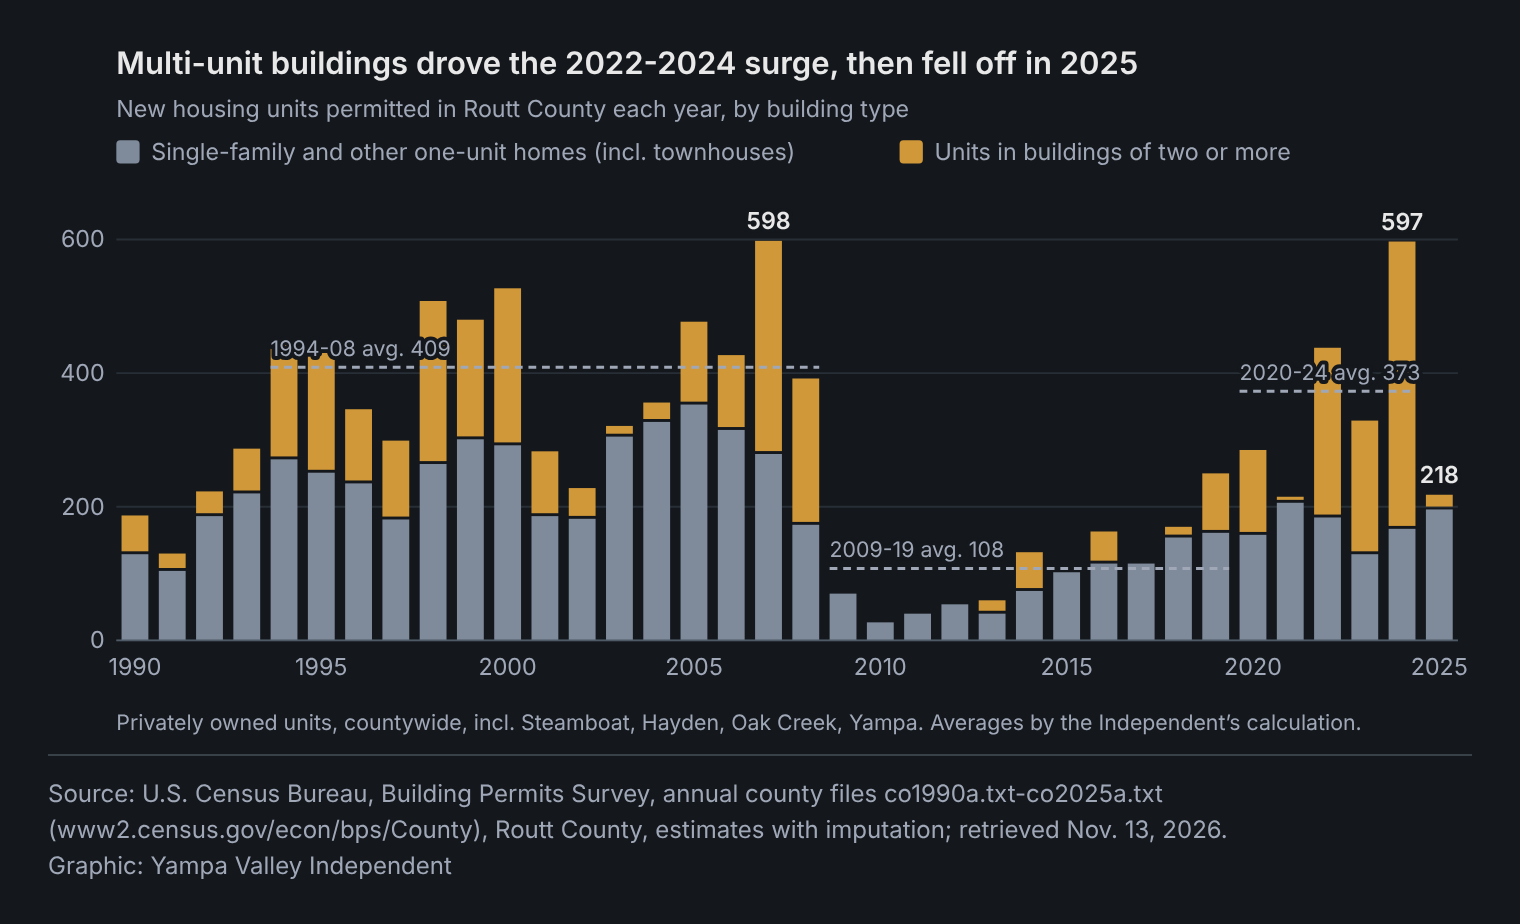
Census permit records for privately owned housing go back to 1990. From 1994 through 2008, Routt County permitted an average of 409 new housing units a year, by the Independent's calculation. After the 2008 crash, the average fell to 108 a year from 2009 through 2019.
It rebounded to 373 a year from 2020 through 2024, led by buildings of five or more units. The 597 units permitted in 2024, 418 of them in such buildings, were one short of 2007's 598, the most since at least 1990.
In 2025, Routt permitted 218 units, only 19 of them in buildings of five or more, while permits for single-family and other one-unit homes, a category that includes townhouses, rose to 196 from 167.
This year the preliminary Census figures run the other way. In the first nine months of 2026, one-unit permits fell to 126 from 164 a year earlier, a 23% drop and among the largest of the 11 ski counties. Total units rose 17%, to 218 from 186, because of two buildings with 90 units between them.
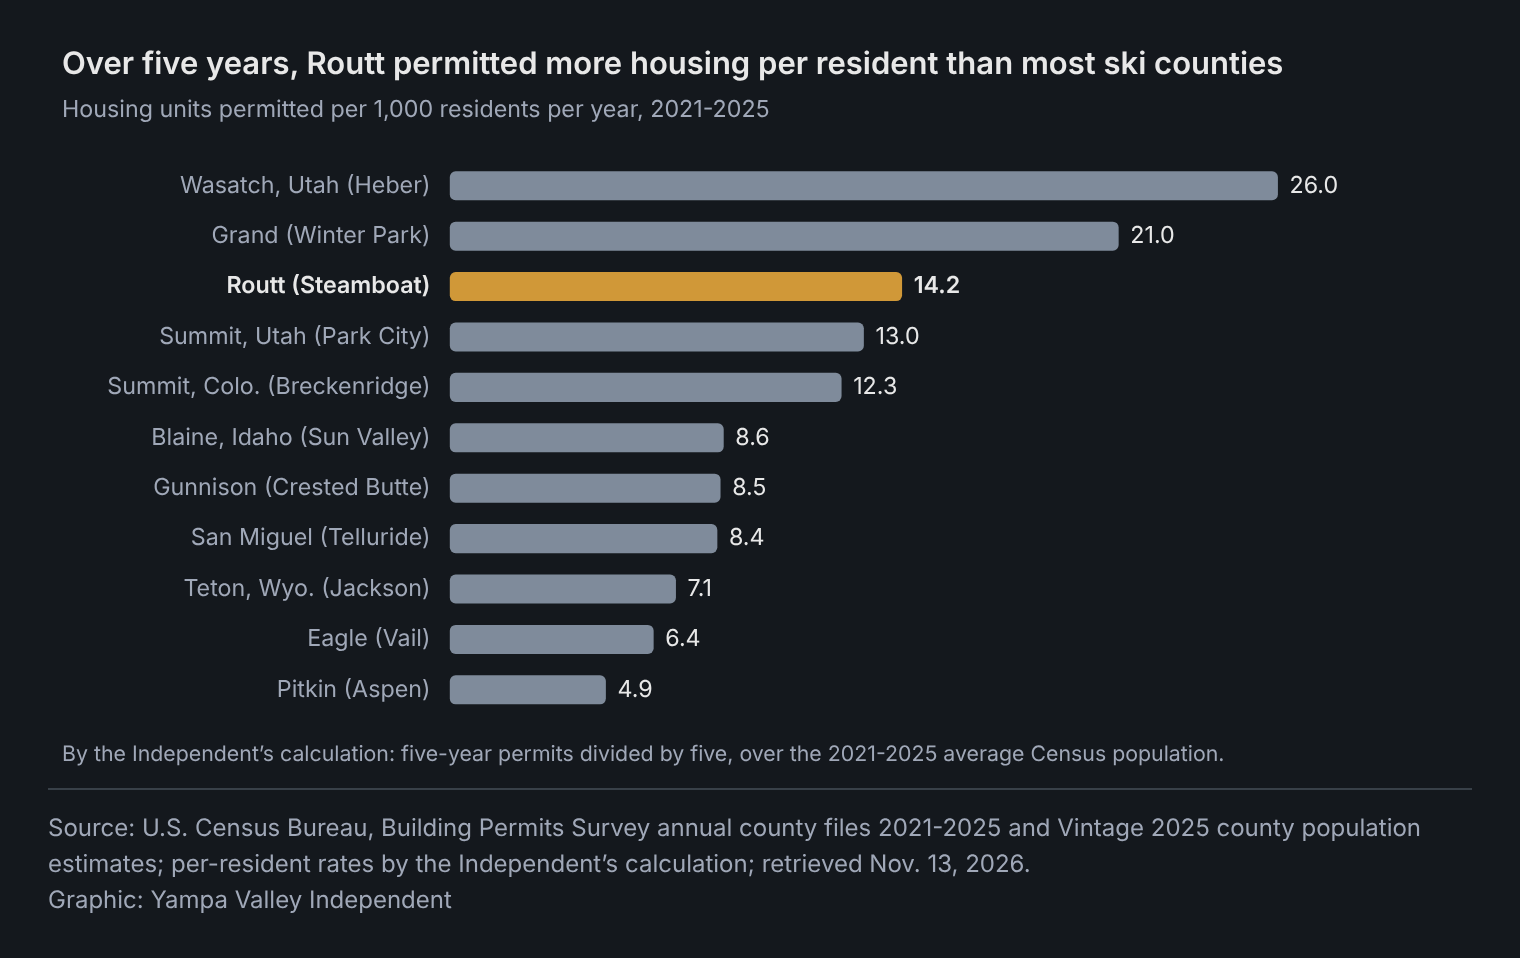
Over five years, Routt hasn't lagged. From 2021 through 2025, it permitted 14.2 units a year for every 1,000 residents, third among the 11 ski counties behind Utah's Wasatch County (26.0) and Grand County (21.0), and nearly three times Pitkin County's 4.9, by the Independent's calculation. In 2025 alone, it ranked fifth.
The Census counts permits countywide, so these figures include Hayden, Oak Creek, Yampa and unincorporated Routt as well as Steamboat.
Whether approval times play a part is something the permit counts can't show. The Independent's Nov. 6 analysis of the city's own records for 100 projects that reached a final hearing found the typical one took 113 days from a complete application to that hearing, and about seven months from its first meeting with planners. Applicants' own response time took the biggest share, 43%.
By the numbers: 11 Western ski counties
Routt's growth in homes for sale since 2021 and this year's drop in one-unit permits are among the largest of the 11 counties.
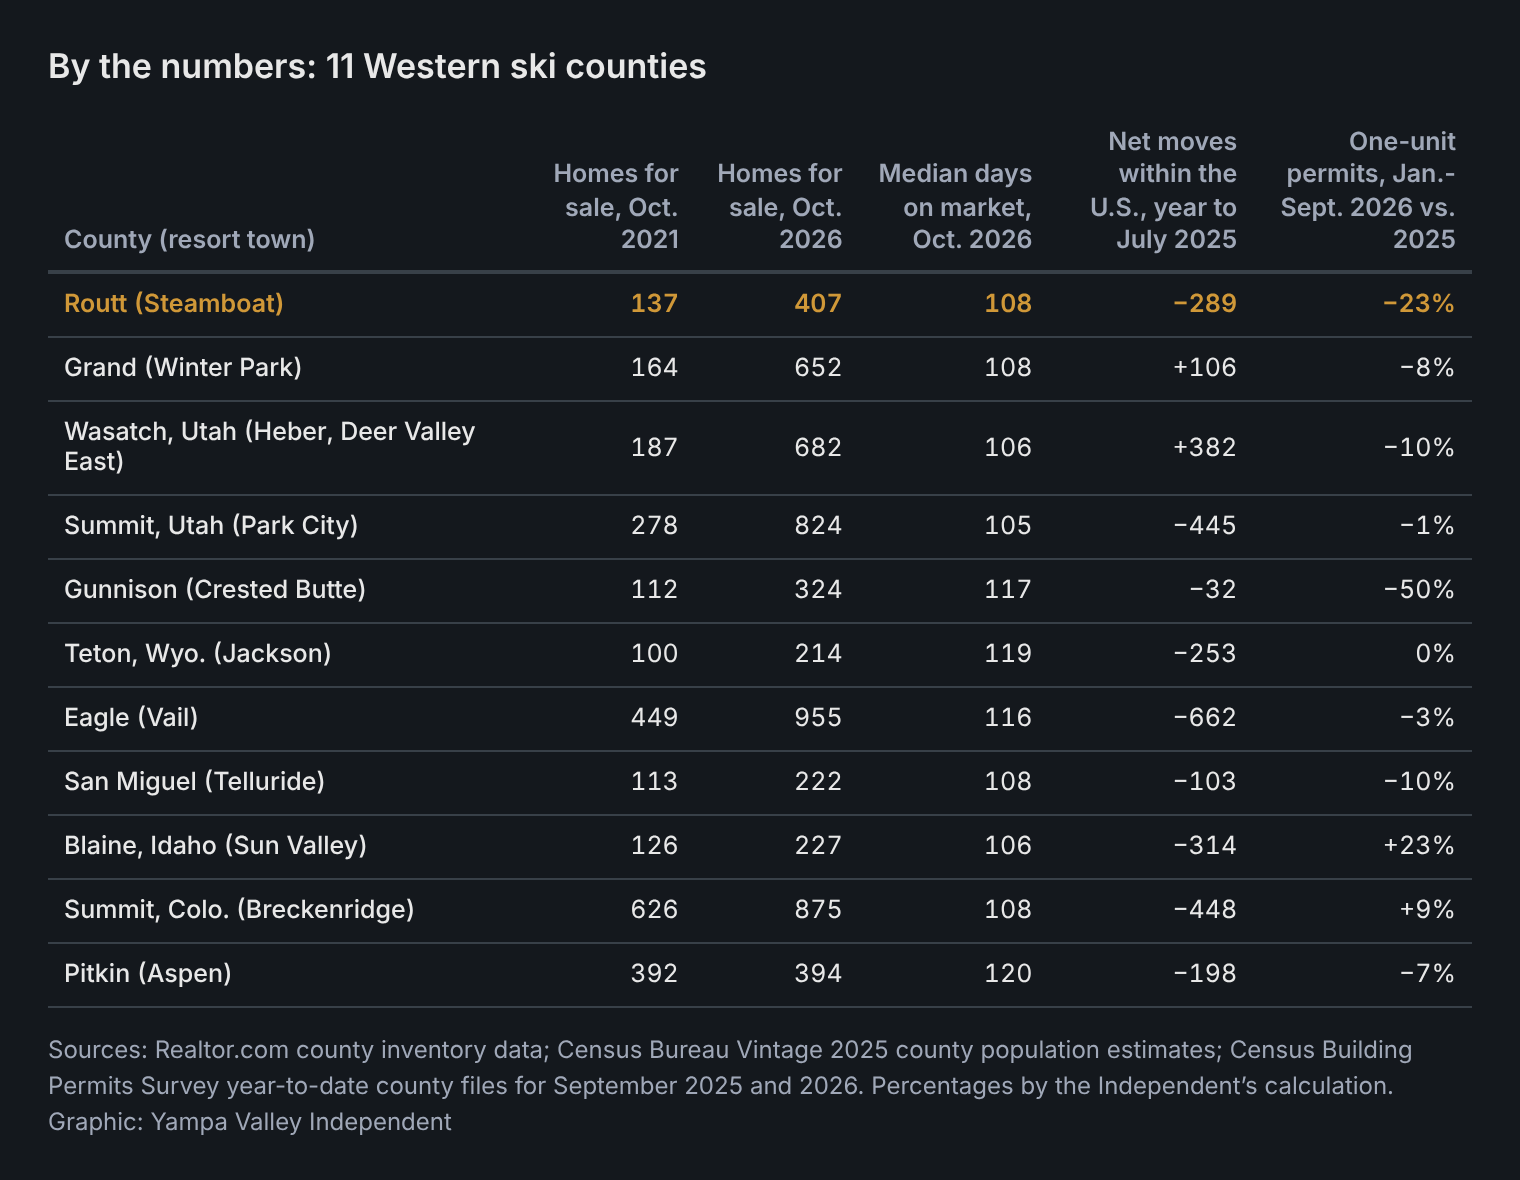
Routt first, then the others sorted by growth in homes for sale. Realtor.com flags a data change in October 2021 for San Miguel, Gunnison, Summit (Utah) and Teton, and in October 2026 for Summit (Colo.), Pitkin, San Miguel and Blaine. Permit figures for 2025 and 2026 are preliminary year-to-date estimates. Sources: Realtor.com county inventory data; Census Bureau Vintage 2025 county population estimates; Census Building Permits Survey year-to-date county files for September 2025 and 2026. Percentages by the Independent's calculation. Counties include towns beyond the resort named.
What's next
- Saturday, Nov. 21: Steamboat Resort's scheduled opening day.
- Late November: the Census Bureau's October building permit figures for counties.
- Early December: Realtor.com's November listing data.
- December: the Census Bureau's 2021-2025 five-year American Community Survey estimates.
Sources: Realtor.com Economic Research county and national inventory data; U.S. Census Bureau American Community Survey tables B08301 and K200801, county population estimates (Vintage 2025 and Vintage 2020) and Building Permits Survey county files; the Federal Housing Finance Agency's all-transactions house price index for Routt County, via FRED; the Routt County Assessor's sales records; and the Independent's Nov. 6 analysis of Steamboat's development review.