
Buffalo Pass nears November with no snowpack after a fall of above-freezing storms
Federal snow data show the high station near Buffalo Pass tied for its lowest reading on the date since 1979, and most fall precipitation there came on days that stayed above freezing.


Key points
- The federal snow station near Buffalo Pass, northeast of Steamboat Springs, started Oct. 30 with no snow water on its sensor. The 1991–2020 median for the date is 2.1 inches.
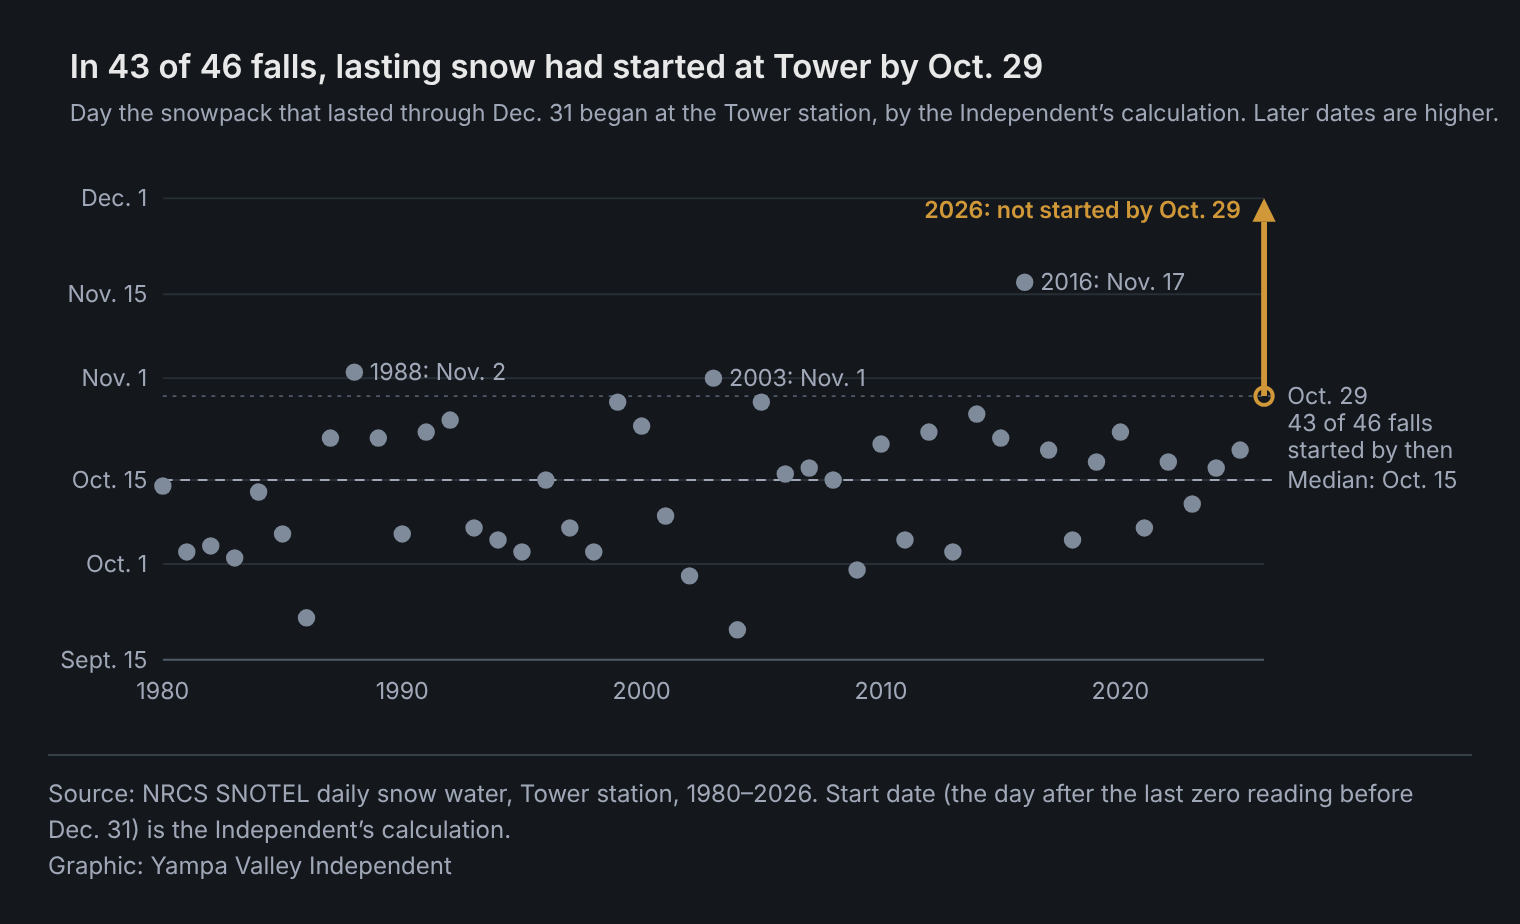
- That ties 1988 and 2003 for the station's lowest reading on the date since 1979. In 43 of the previous 46 falls, snow that stayed through Dec. 31 had started there by Oct. 29, by the Independent's calculation.
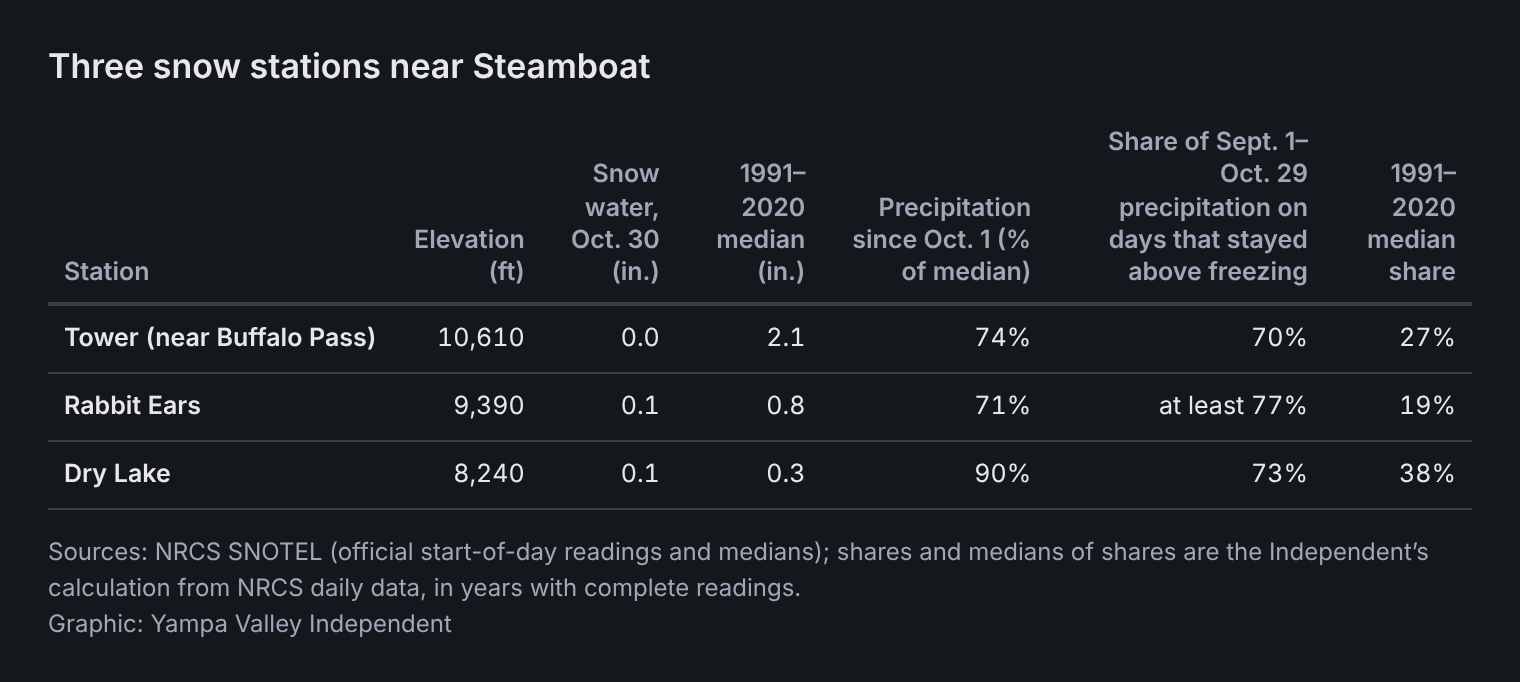
- At the Tower, Rabbit Ears and Dry Lake stations, most September–October precipitation came on days when the temperature stayed above freezing: 70%, at least 77% and 73%, against typical shares of 27%, 19% and 38%, by the Independent's calculation.
- NOAA says El Niño continues to strengthen. Past El Niño Octobers on Buffalo Pass have run from snowy to dry, and after past late starts there, the next winter's snowpack has varied.
The federal snow station near Buffalo Pass, northeast of Steamboat Springs, started Friday with no snow water on its sensor, according to the U.S. Department of Agriculture's Natural Resources Conservation Service.
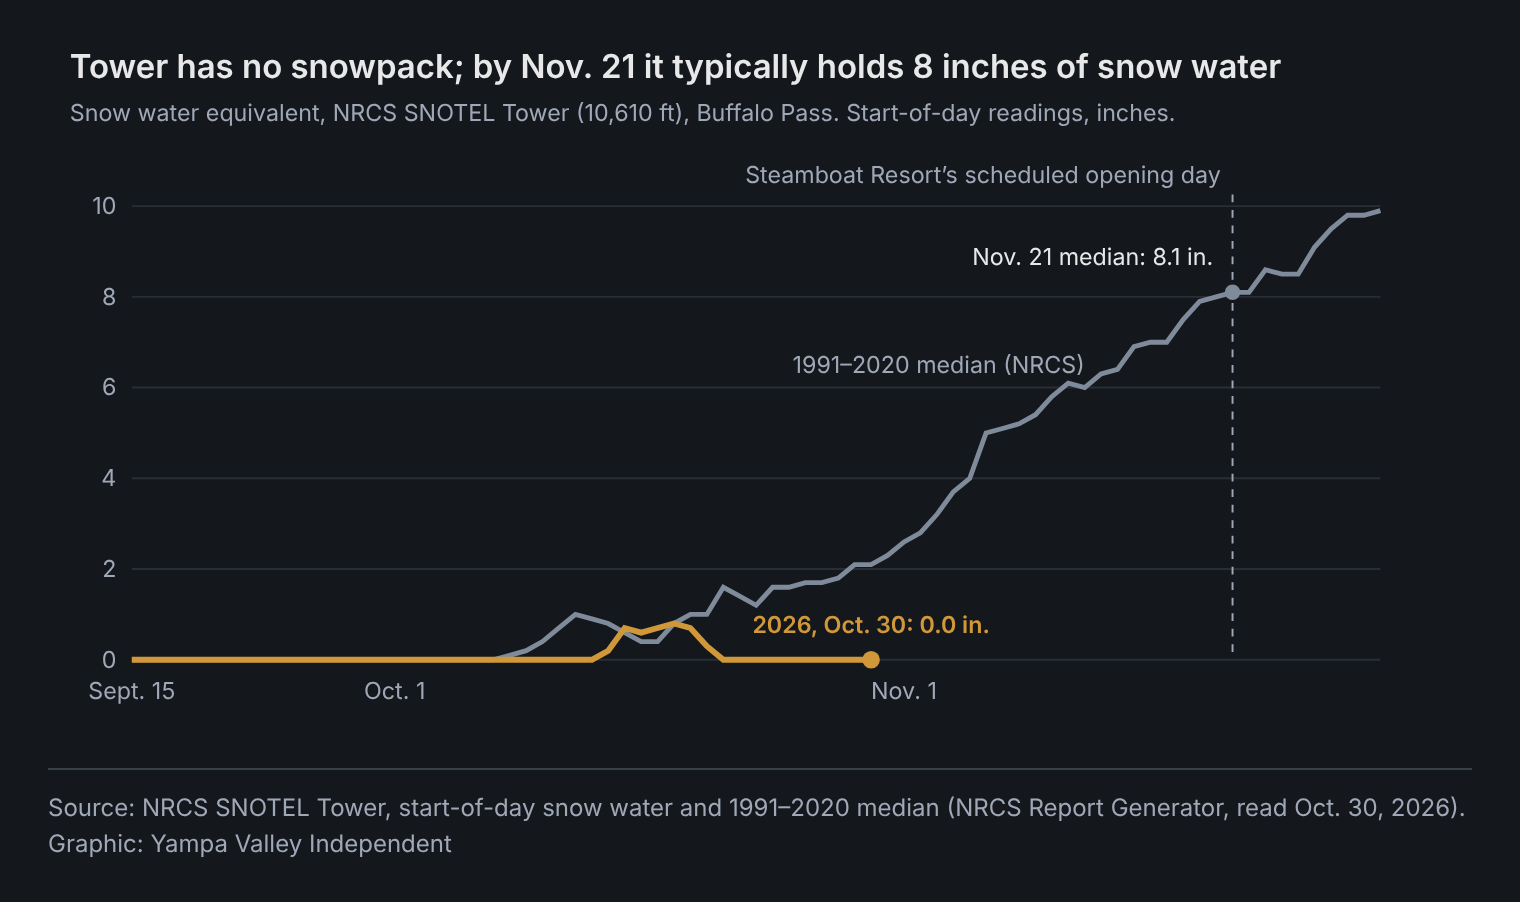
The station, called Tower, sits at 10,610 feet. On a typical Oct. 30 it holds 2.1 inches of snow water, the 1991–2020 median NRCS uses for comparison. Friday's reading of 0.0 inches ties 1988 and 2003 for the lowest on that date in 48 years of daily records, by the Independent's review of NRCS data.
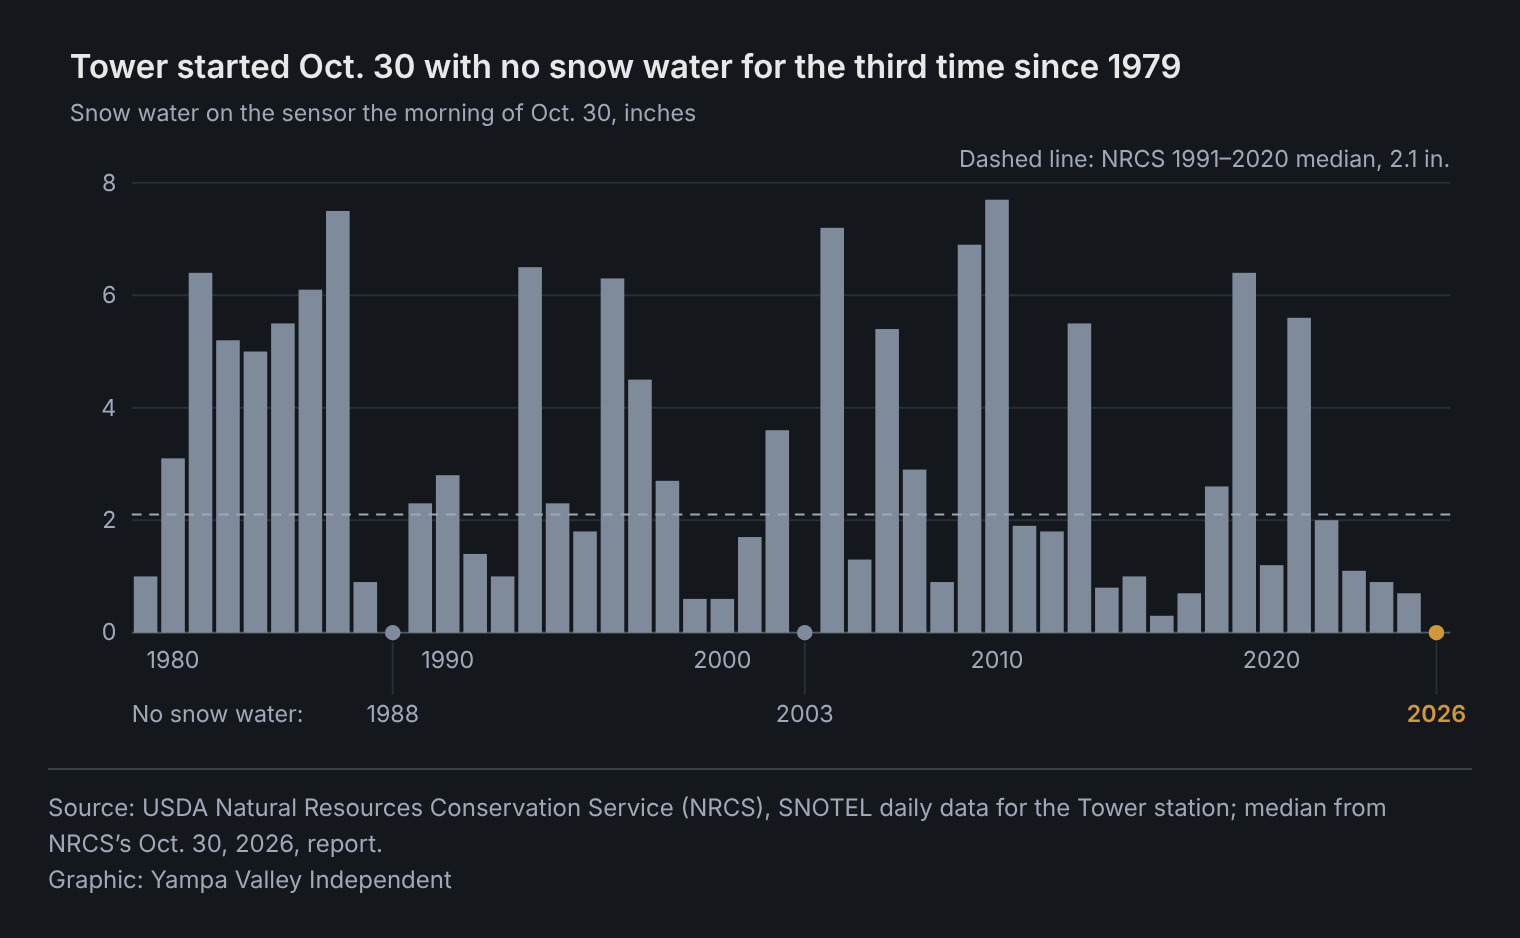
The records show a warm fall in which most of the precipitation came on days that stayed above freezing, by the Independent's analysis. It follows a winter in which two of the three stations recorded their lowest peak snowpack on record.
A late start, so far
Snow that stays on the ground through Dec. 31 hasn't started at Tower. In 43 of the 46 falls from 1980 through 2025, that lasting snow had settled on the station by Oct. 29, by the Independent's calculation. The median start was Oct. 15. The exceptions were 1988, 2003 and 2016.
Snow did fall this month. A mid-October storm left 5 inches of snow on the ground at Tower at the end of Oct. 14 and built 0.8 inch of snow water by the end of Oct. 17. It was gone by the morning of Oct. 21.
Two lower stations are also below their medians. The Rabbit Ears station, at 9,390 feet southeast of town, started Friday with 0.1 inch of snow water, against a median of 0.8 inch. Dry Lake, at 8,240 feet between town and Tower, had 0.1 inch, against 0.3 inch. Those readings are low but not unusual for late October. By the Independent's count, Rabbit Ears had 0.1 inch or less on the date in 10 of the previous 40 years, and Dry Lake in 18 of 45.
Storms on above-freezing days
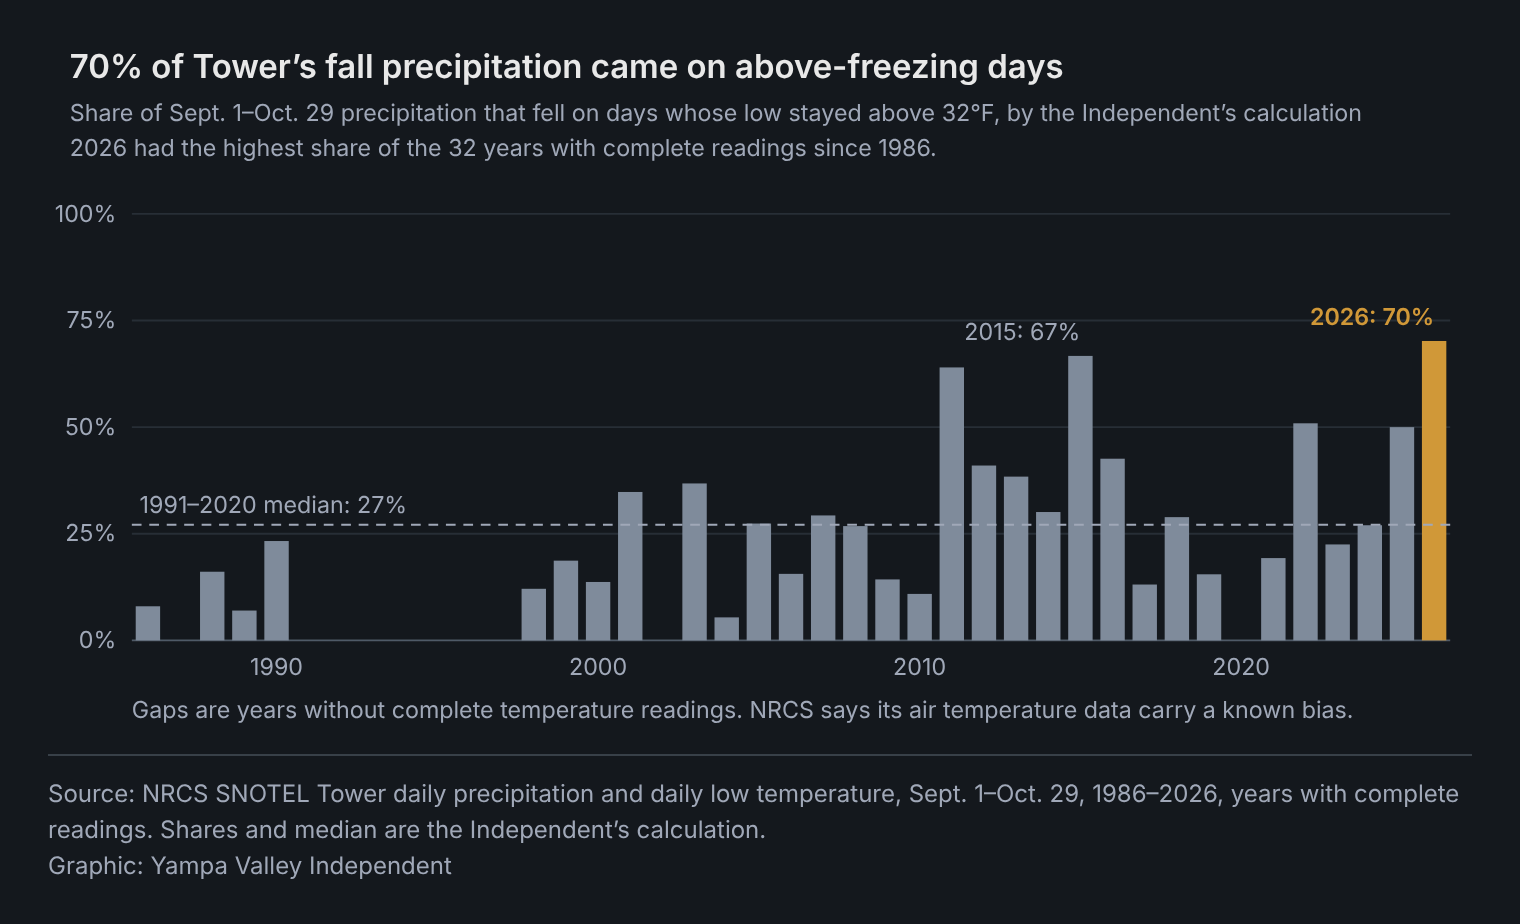
From Sept. 1 through Oct. 29, 5.7 inches of precipitation fell at Tower. Of that, 4.0 inches, or 70%, fell on days when the station's temperature stayed above 32 degrees, by the Independent's calculation. In the 22 years from 1991 to 2020 with complete readings, the median share was 27%. This fall's share is the highest in the 32 years with complete readings since 1986; the next highest was 67%, in 2015. NRCS cautions that its "air temperature data contains a known bias."
The other two stations show the same pattern. At Rabbit Ears, at least 77% fell on days that stayed above freezing, against a median of 19%, the highest in 31 years. At Dry Lake, it was 73%, against 38%, the third-highest in 35 years, behind 1987 and 1988.
The station's snow pillow, which weighs the snow on the ground, tells the same story. Of the 5.7 inches of precipitation at Tower, 0.9 inch registered as new snow water, or 16%. The 1991–2020 median was 59%, and since 1980 only 2003 was lower, by the Independent's calculation.
Two storms show the pattern. From Sept. 16 to 19, 1.7 inches fell at Tower while daily lows stayed at 34.9 degrees or warmer. On Oct. 10, 0.8 inch fell with a low of 35.4 degrees, and the snow pillow stayed at zero.
A wet September, a dry October
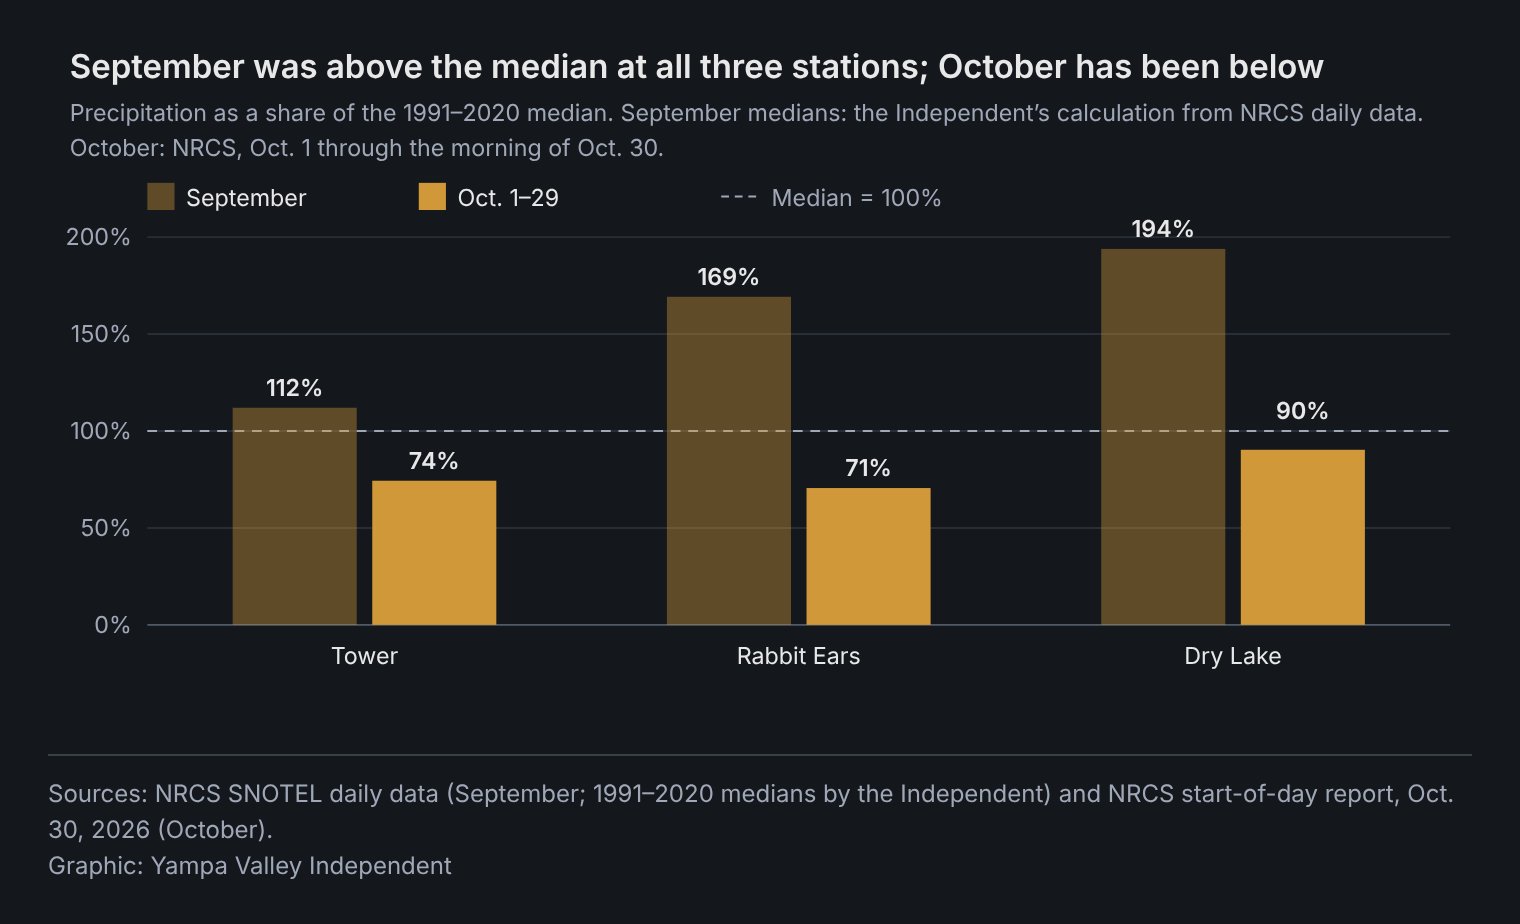
September was wetter than usual at the two lower stations and slightly above the median at Tower. Tower got 2.8 inches, against a 1991–2020 median of 2.5 inches, by the Independent's calculation. Rabbit Ears got 3.3 inches, against 1.95, and Dry Lake 3.2 inches, against 1.65.
October has been drier. Since Oct. 1, precipitation is 74% of the median at Tower, 71% at Rabbit Ears and 90% at Dry Lake, according to NRCS.
Warm on the pass and in town
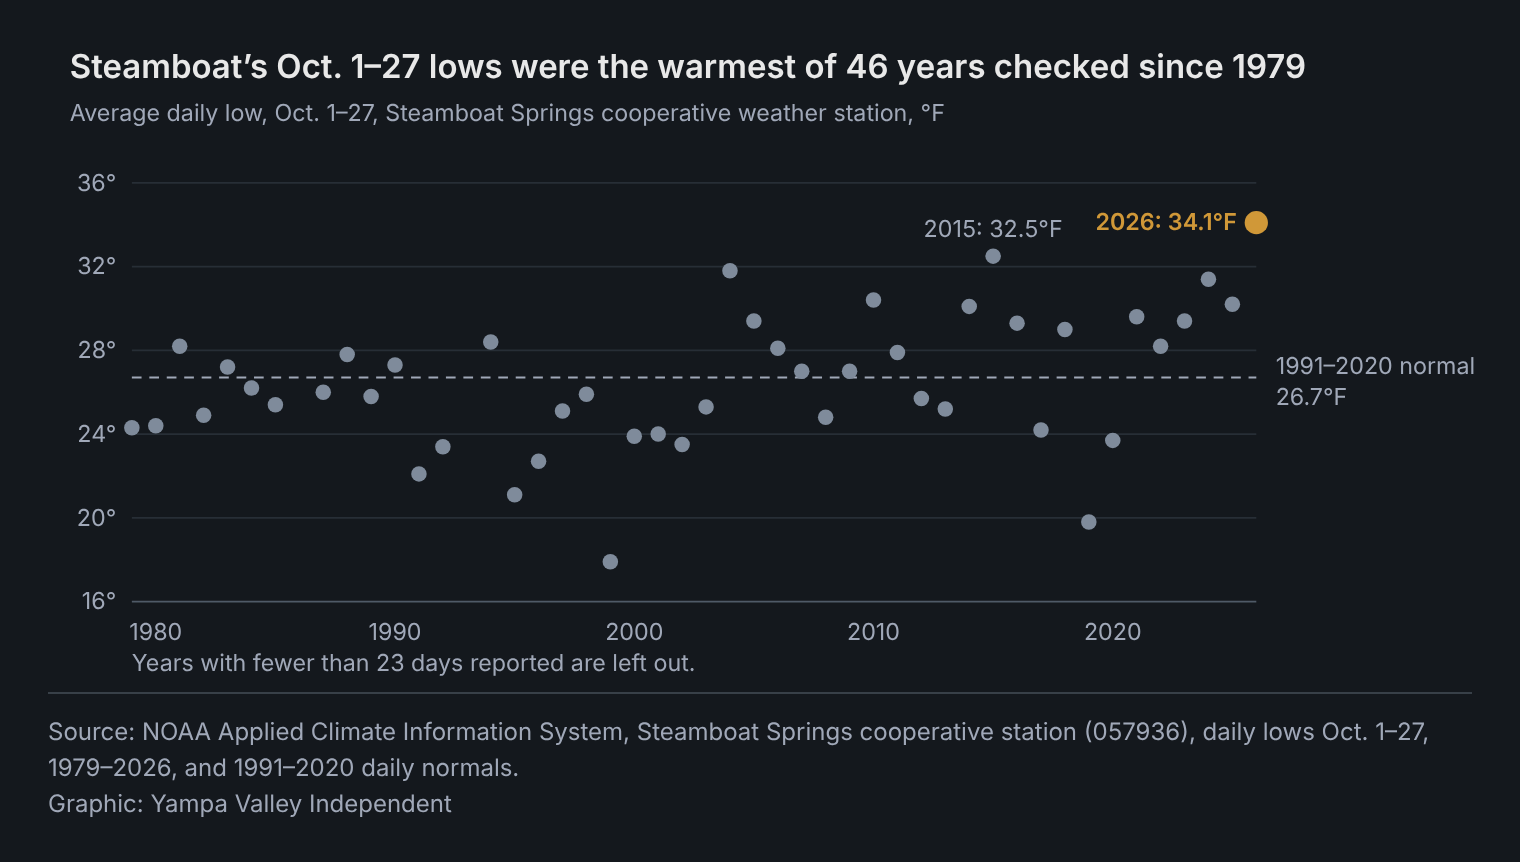
In Steamboat Springs, the National Weather Service's cooperative station averaged a high of 67.7 degrees from Oct. 1 to 27, against a normal of 60.4. Its average low was 34.1 degrees, against 26.7. That is the warmest average low for those dates since 1979, the earliest year the Independent checked, and the fourth-warmest average high.
The town was also wetter than normal. The station recorded 3.07 inches in September, with 28 of 30 days reported, against a normal of 2.32 inches. It recorded 2.08 inches from Oct. 1 to 24, against 1.77.
In town, normal snowfall from Oct. 1 to 29 is 6.0 inches. The station's October snowfall reports aren't yet in NOAA's database. A CoCoRaHS volunteer station west of town reported no snow on any day from Oct. 1 to 29. On Oct. 15, when the three volunteer stations measured 0.69 to 0.90 inch of precipitation, one east of downtown reported 0.3 inch of snow and one north of town reported a trace. The official station recorded no snow from Oct. 1 to 29 in six years since 1979, most recently in 2024.
On the pass, Tower averaged 39.4 degrees from Oct. 1 to 29, against a 1991–2020 median of 32.7. Dry Lake averaged 45.3, against 39.0. At both, only 2024 was warmer since 1986, by the Independent's calculation; at Tower, 2015 was a tenth of a degree cooler than this year.
El Niño's record here is mixed
In its Oct. 8 discussion, NOAA's Climate Prediction Center kept an El Niño advisory in place and said El Niño "continues to strengthen." It said a strong to very strong El Niño is likely to last through January–March 2027, putting the chance above 83%. CPC's Relative Oceanic Niño Index, which tracks tropical Pacific sea-surface temperatures, stood at +1.69 for July through September, the latest value.
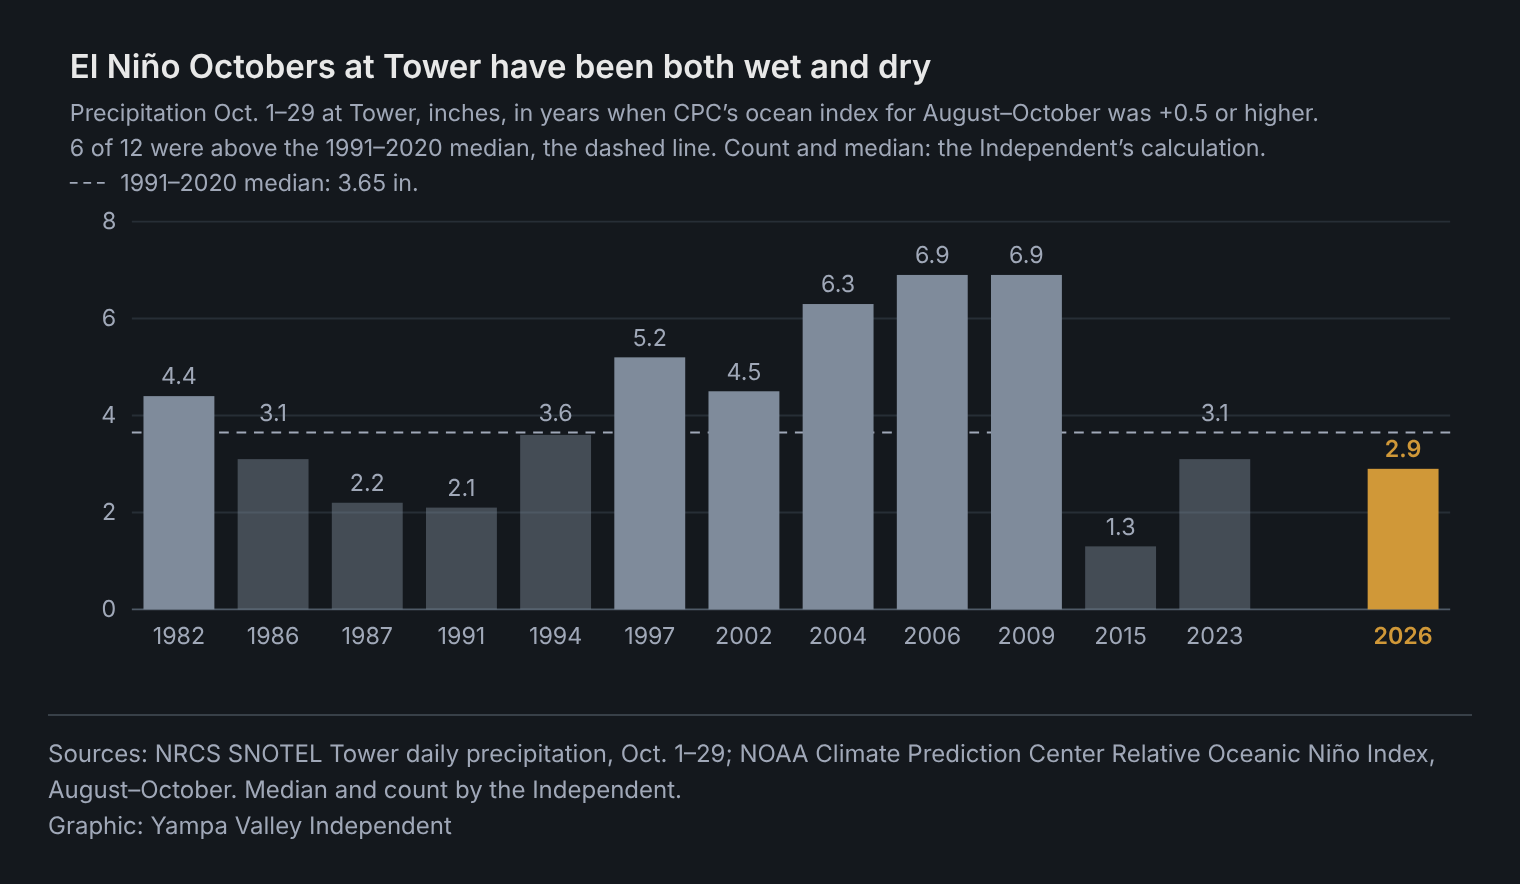
Past El Niño Octobers don't show one pattern on Buffalo Pass. By the Independent's count, the index was +0.5 or higher in 12 August–October periods from 1979 to 2025. At Tower, precipitation from Oct. 1 to 29 in those years ranged from 1.3 inches in 2015 to 6.9 inches in 2006 and 2009, and six of the 12 were above the 1991–2020 median. Four of the 10 with complete temperature readings were warmer than the median. In the two strongest of those periods, 1997 and 2015, Tower had 4.5 inches and 1.0 inch of snow water on Oct. 29. The data alone can't say what drove this October.
After past late starts
After the late starts of 1988, 2003 and 2016, Tower's snowpack peaked the next spring at 52.6, 40.6 and 44.5 inches of snow water. The 1991–2020 median peak is about 49 inches, by the Independent's calculation, so one of those winters ended above the median and two below.
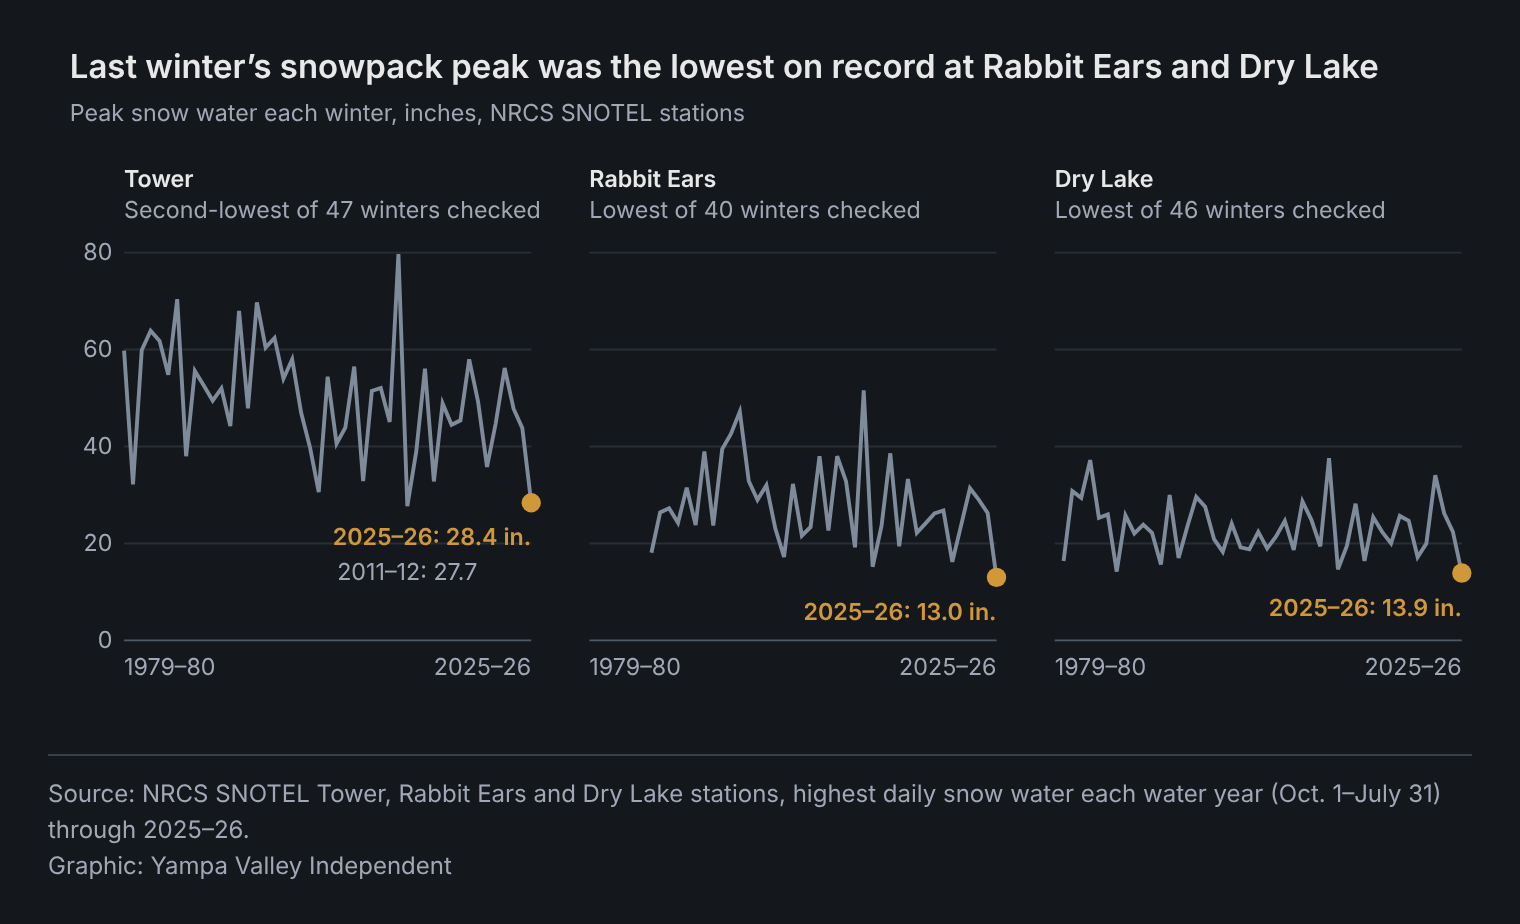
Last winter was different. Tower's snowpack peaked at 28.4 inches, the second-lowest since 1980, after 2012's 27.7. Rabbit Ears peaked at 13.0 inches and Dry Lake at 13.9, the lowest in their records, which began in 1987 and 1981. From December through April, city sales tax collections were $1.1 million, or 5.0%, below the year before, by the Independent's calculation from the city's monthly tax reports. The reports don't give a reason.
How we did this
The Independent downloaded daily data for Tower, Rabbit Ears and Dry Lake from NRCS's snow survey database and for the Steamboat Springs cooperative station and three CoCoRaHS stations from NOAA's Applied Climate Information System, and El Niño readings from the Climate Prediction Center. Medians, shares and rankings are the Independent's calculations from the daily records, except where NRCS's own medians are named. NRCS labels recent data provisional, so figures may be revised. Precipitation "on days that stayed above freezing" counts days whose daily low stayed above 32 degrees, in years when daily lows cover days holding at least 95% of the precipitation. The data and calculations are in the story's backup folder.
This is one of two data stories the Independent is publishing on Steamboat's economy and climate. The other looks at the city's aging population and its job base.
By the numbers
What's next
- Nov. 12: NOAA's Climate Prediction Center issues its next monthly El Niño discussion.
- Nov. 21: Steamboat Resort's scheduled opening day, according to its website.
- Daily: NRCS posts new SNOTEL readings each morning. The Independent will update these figures before opening day.
Sources: USDA Natural Resources Conservation Service SNOTEL data: the Oct. 30 start-of-day report, Tower’s snow water and median, Sept. 15–Nov. 30 and daily station data, with the same query for the Rabbit Ears and Dry Lake stations; NOAA’s Applied Climate Information System (Steamboat Springs cooperative station and three CoCoRaHS volunteer stations); NOAA Climate Prediction Center ENSO discussion of Oct. 8 and Relative Oceanic Niño Index; City of Steamboat Springs monthly tax reports for December, January, February, March and April; Steamboat Resort.